HR KPIs (Key Performance Indicators) Explained With Example Dashboards
As an HR Analytics Director, it is important to measure the success of human resources initiatives. One effective way to do this is by using Key Performance Indicators (KPIs). KPIs are measurable values that help us understand how well we are achieving our goals. In this article, we will explore a list of essential HR KPIs and explain their benefits. Some of these KPIs are interrelated, meaning they depend on each other or share a connection. Let’s dive in!
Hiring
Some of the easiest HR KPI to talk about (and some of the absolute ugliest data you’ll see in HR) is hiring. Why easy? Because jobs are everywhere; most of us have gone – or will go – through the hiring process as an employee. Why ugly? Because the data often comes from different systems that don’t like to play nice with one another. Workday data (the jobs we need to hire for) and Greenhouse data (a system that holds open jobs’ and applicants’ info), for instance, is notoriously difficult to merge.
Data issues aside, these KPIs cover the entire funnel from the number of open jobs to the number and quality of applicants to the company’s ability to fill their open jobs.
Open Jobs
One of the easier metrics for HR managers to track is Open Jobs. This is purely the number of openings the company or group has, month-to-month.
The dashboard below from New Mexico State University does a good job of comparing open positions to qualified candidates for Taos County, NM. Because it’s public-facing, it works well for those in hiring and job seekers alike. It’s easy to see that there’s a real shortage of qualified candidates for Registered Nurses and Teachers/Instructors, while they can afford to be very selective when hiring Customer Service Reps.
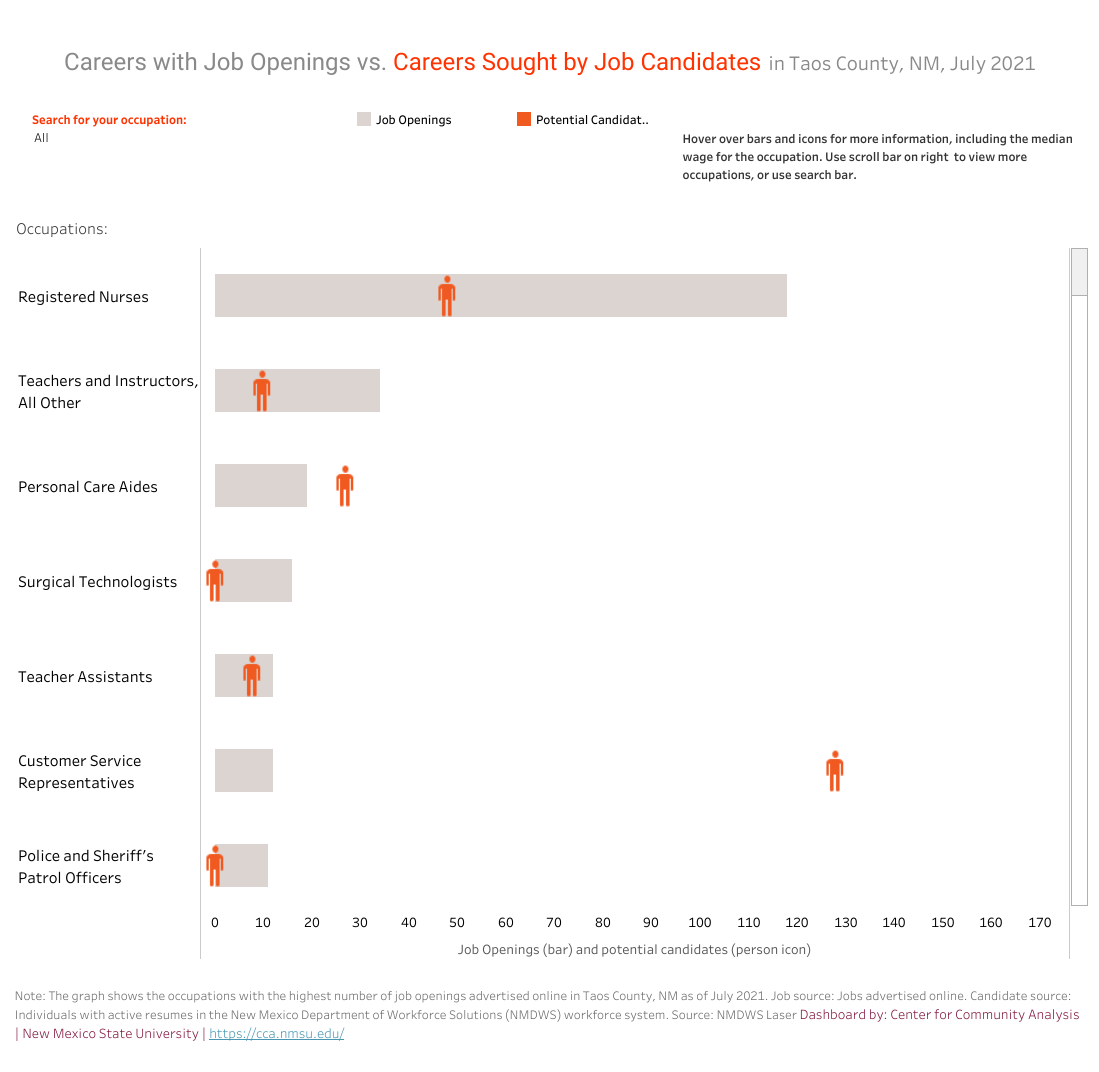
One thing that would make this more immediately readable would be coloring the bars by whether there are more or less candidates than openings. Or, they could show the next KPI instead, Qualified Candidates Per Opening.
Qualified Candidates Per Opening
Qualified Candidates per Opening measures the number of suitable candidates available for each open position. A higher ratio indicates a broader talent pool, making it easier to find qualified individuals for vacancies.
Using this KPI can immediately help see how selective a company can be in hiring. Let’s use the dashboard above as an example. Looking only at jobs that have more candidates than openings, there are 27 Personal Care Aide candidates to 19 openings, or 1.4 candidates per opening (27/19). If a company in Taos County is trying to fill 2 openings, they may only have 3 qualified candidates to choose from.
Contrast that to Customer Service Reps, who have 128 candidates to 12 openings, a ratio of 10.7. Those hiring Customer Service Reps can afford to select the best of the best, because they’re only going to hire the top 9.4% of applicants. Side note: the irony is that it may be harder to fill this job, because they’ll have a LOT more data to sift through!
Days To Offer
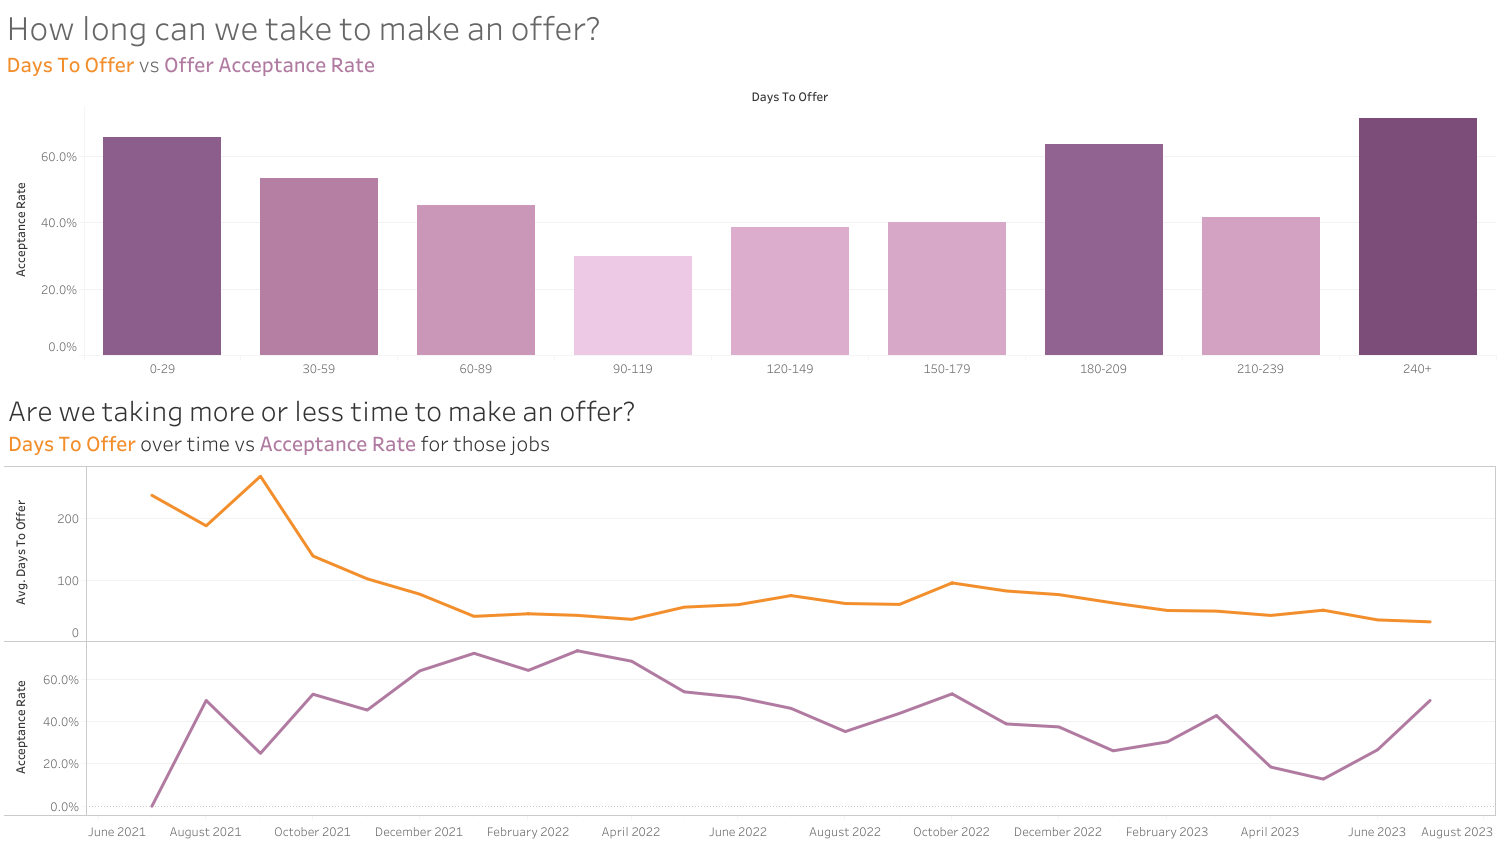
Two HR KPIs that are intimately linked are Days To Offer and Offer Acceptance Rate. Days To Offer measures the average number of days from the start of the recruitment process to the point an offer is made to a candidate. A shorter time frame suggests an efficient hiring process, ensuring that top candidates are not lost due to delays. A longer time frame can lead to candidates finding opportunities elsewhere or becoming disenchanted with the process. Interestingly, as you can see from the visualization below, sometimes candidates become more likely to accept as the process goes on. This may be more likely due to a ‘courtship’ period between the company and the candidate than the job req staying open for a long time.
Offer Acceptance Rate
Offer Acceptance Rate calculates the percentage of candidates who accept job offers out of those who receive them. Monitoring this KPI helps HR evaluate the attractiveness of job offers and identify areas for improvement in the recruitment process. A higher acceptance rate indicates successful candidate engagement and effective offer presentation.
Here’s an example of how Days To Offer and Offer Acceptance Rate can affect each other:
Time To Fill (AKA Time to Hire)
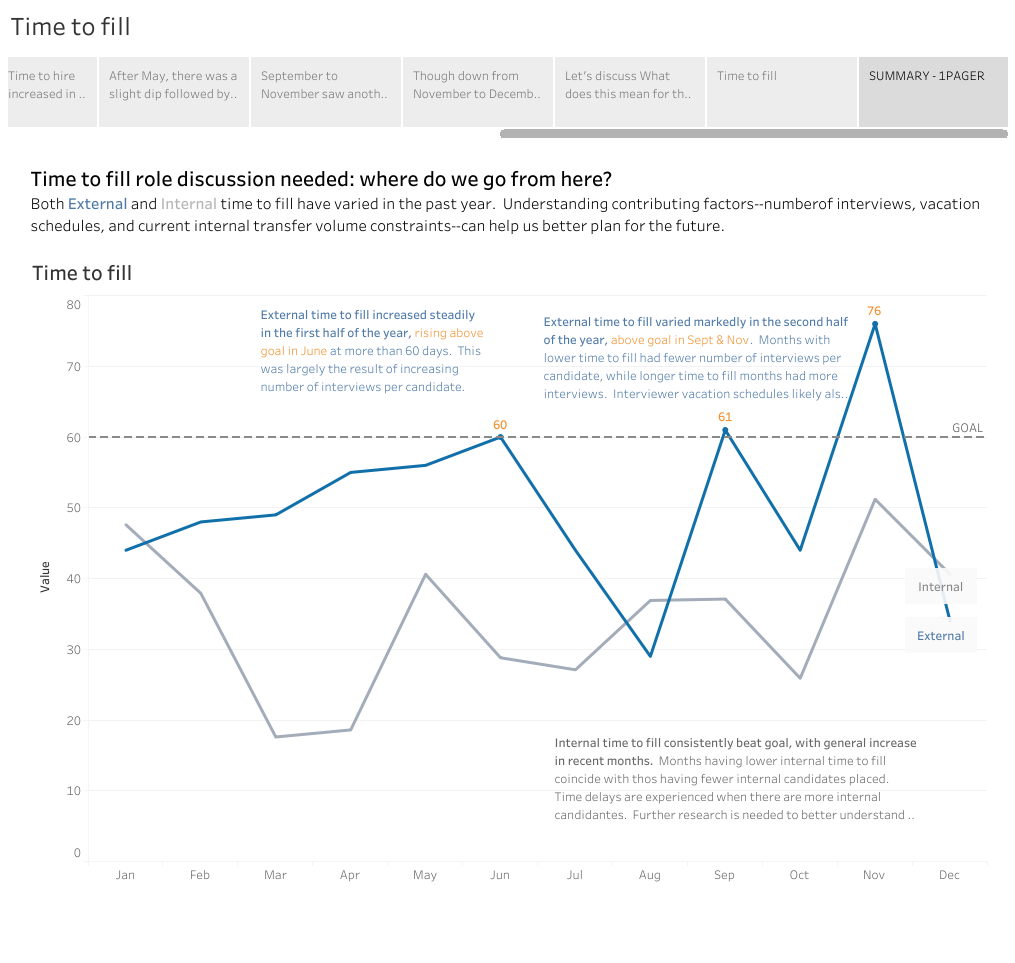
Time To Fill measures the average time it takes to fill a vacant position from the moment it is identified. A shorter time to fill suggests an efficient and well-organized hiring process. It helps HR teams ensure a smooth transition without prolonged gaps in staffing, enabling the organization to maintain productivity levels.
This is different from Days To Offer in that it accounts for all of the time spent before interviews have taken place or the job is even posted. In some companies, they’ll start measuring when they identify a need and don’t even have an open job requisition yet. As someone who’s worked with data for decades, that’s a pretty amazing level of data maturity!
I haven’t seen a better example of storytelling about Time To Fill than Melissa Torres’ story here:
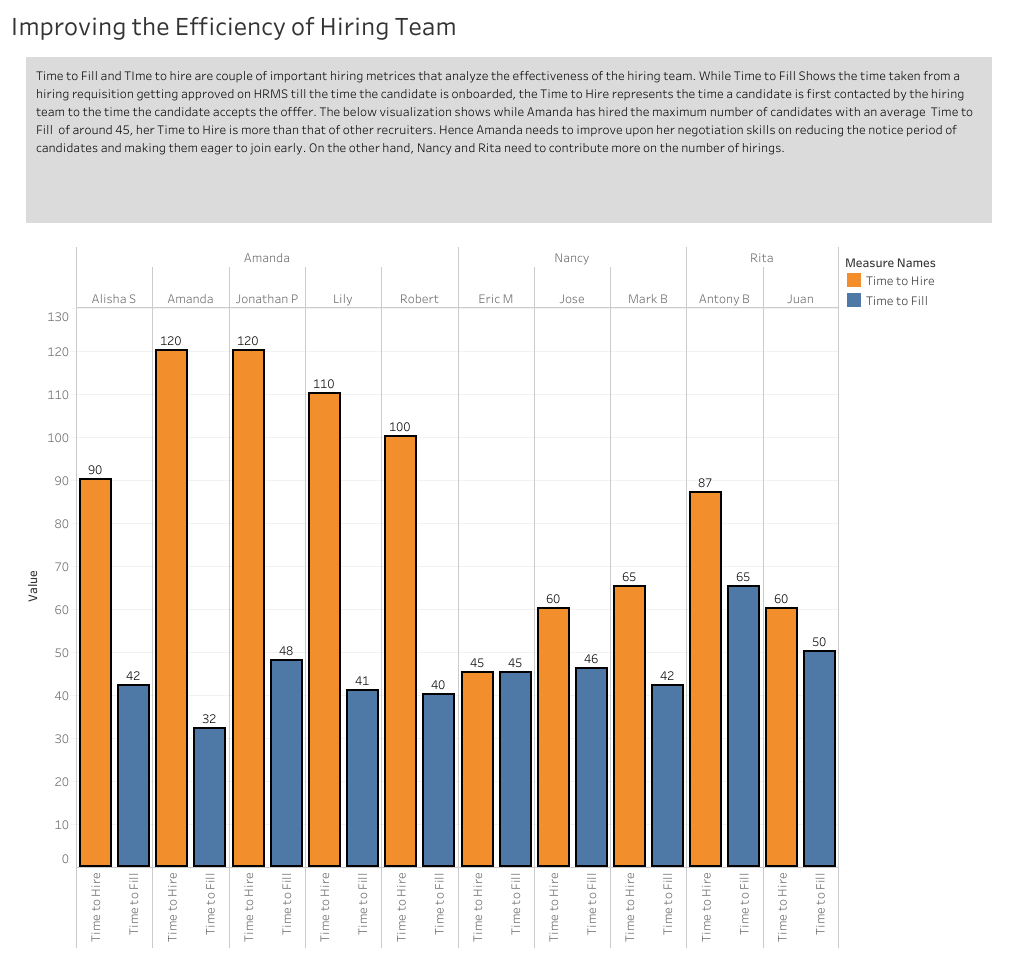
“Time To Hire” as a metric is one that companies disagree about. Some see it as Days To Offer (i.e. employee-centric), and others see it as Time To Fill (i.e. company-centric). We’ve seen it more as the latter, so we’re including it here.
That said, Debjani Guha has a great viz showing the difference in the two below:
Cost Per Hire
One KPI that is directly related to Time To Fill is Cost per Hire. It calculates the average cost incurred to recruit and onboard a new employee. By tracking this KPI, we can assess the efficiency and effectiveness of our recruitment process. Lower cost per hire indicates streamlined hiring procedures and optimized resources. This saves the company money while at least keeping the quality of new hires static, if not improving it.
Hires To Goal (Fill Rate)
Hires To Goal tracks the number of successful hires made in relation to the desired hiring targets. This KPI helps HR assess the effectiveness of recruitment strategies and measure the team’s ability to meet organizational staffing needs.
Recruiting Conversion Rate
Recruiting Conversion Rate measures the percentage of applicants who successfully progress through each stage of the recruitment process. A higher conversion rate indicates that the recruitment process is attracting suitable candidates and efficiently guiding them through the selection process.
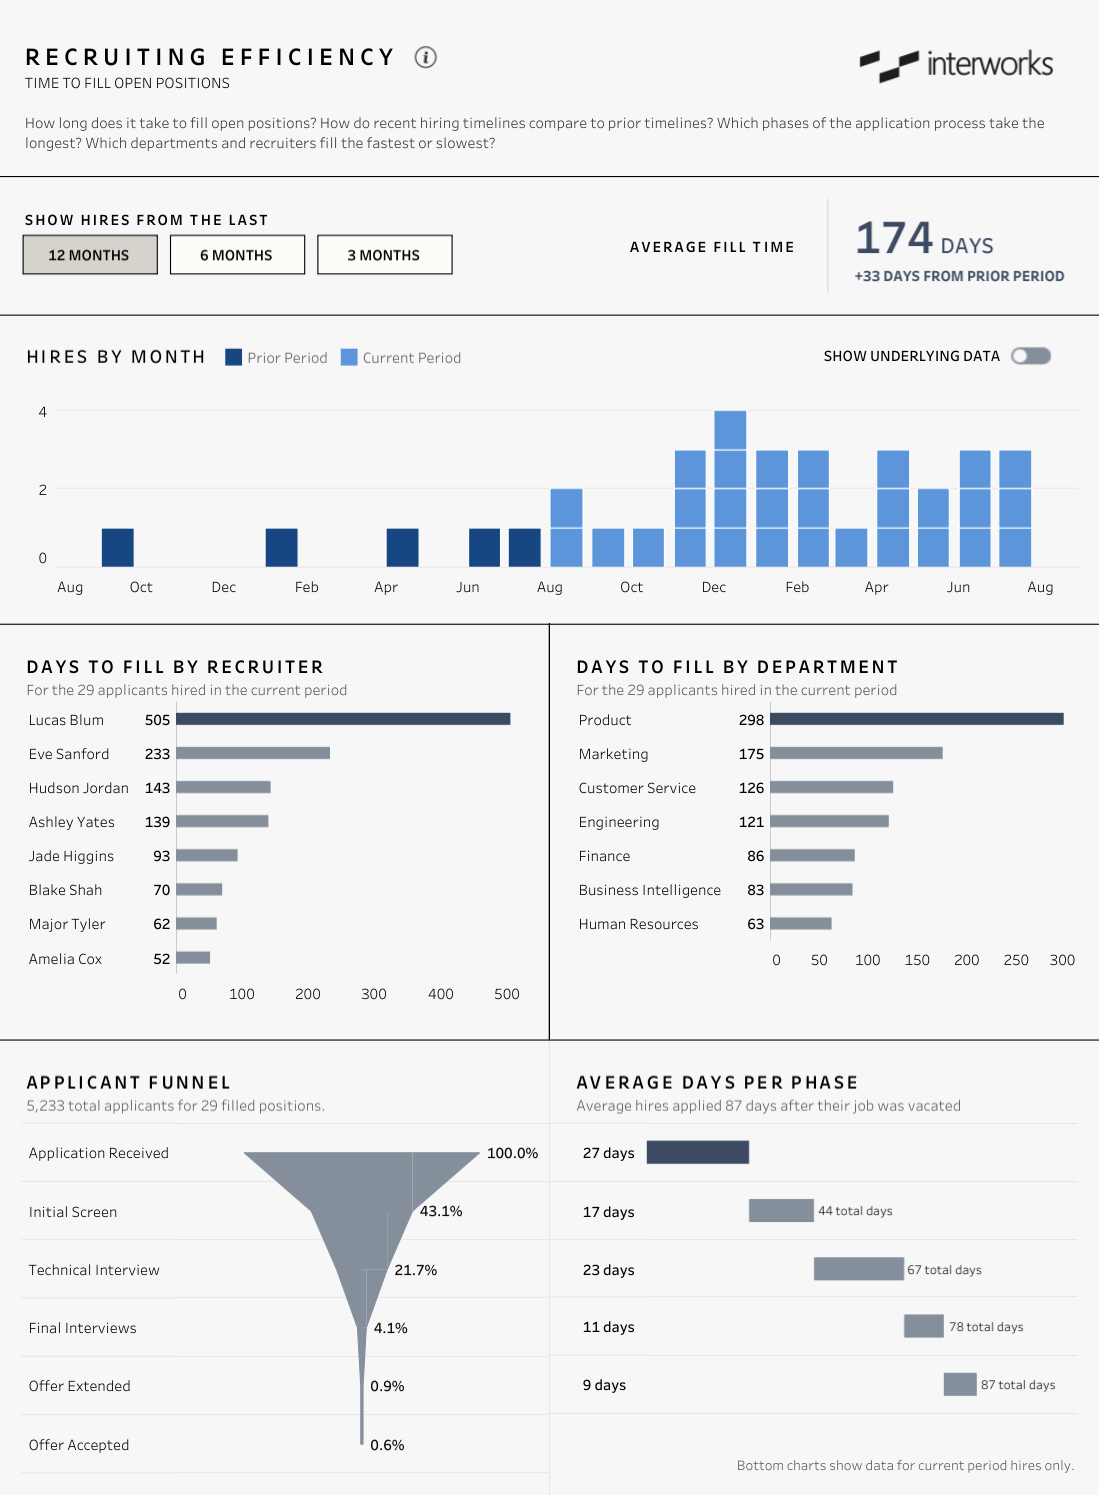
Keith Dykstra of Interworks does an excellent job of bringing so many HR KPIs together – including Recruiting Conversion Rate at the bottom of the Applicant Funnel – in his dashboard here:
On the Job
Talent Rating/Employee Performance
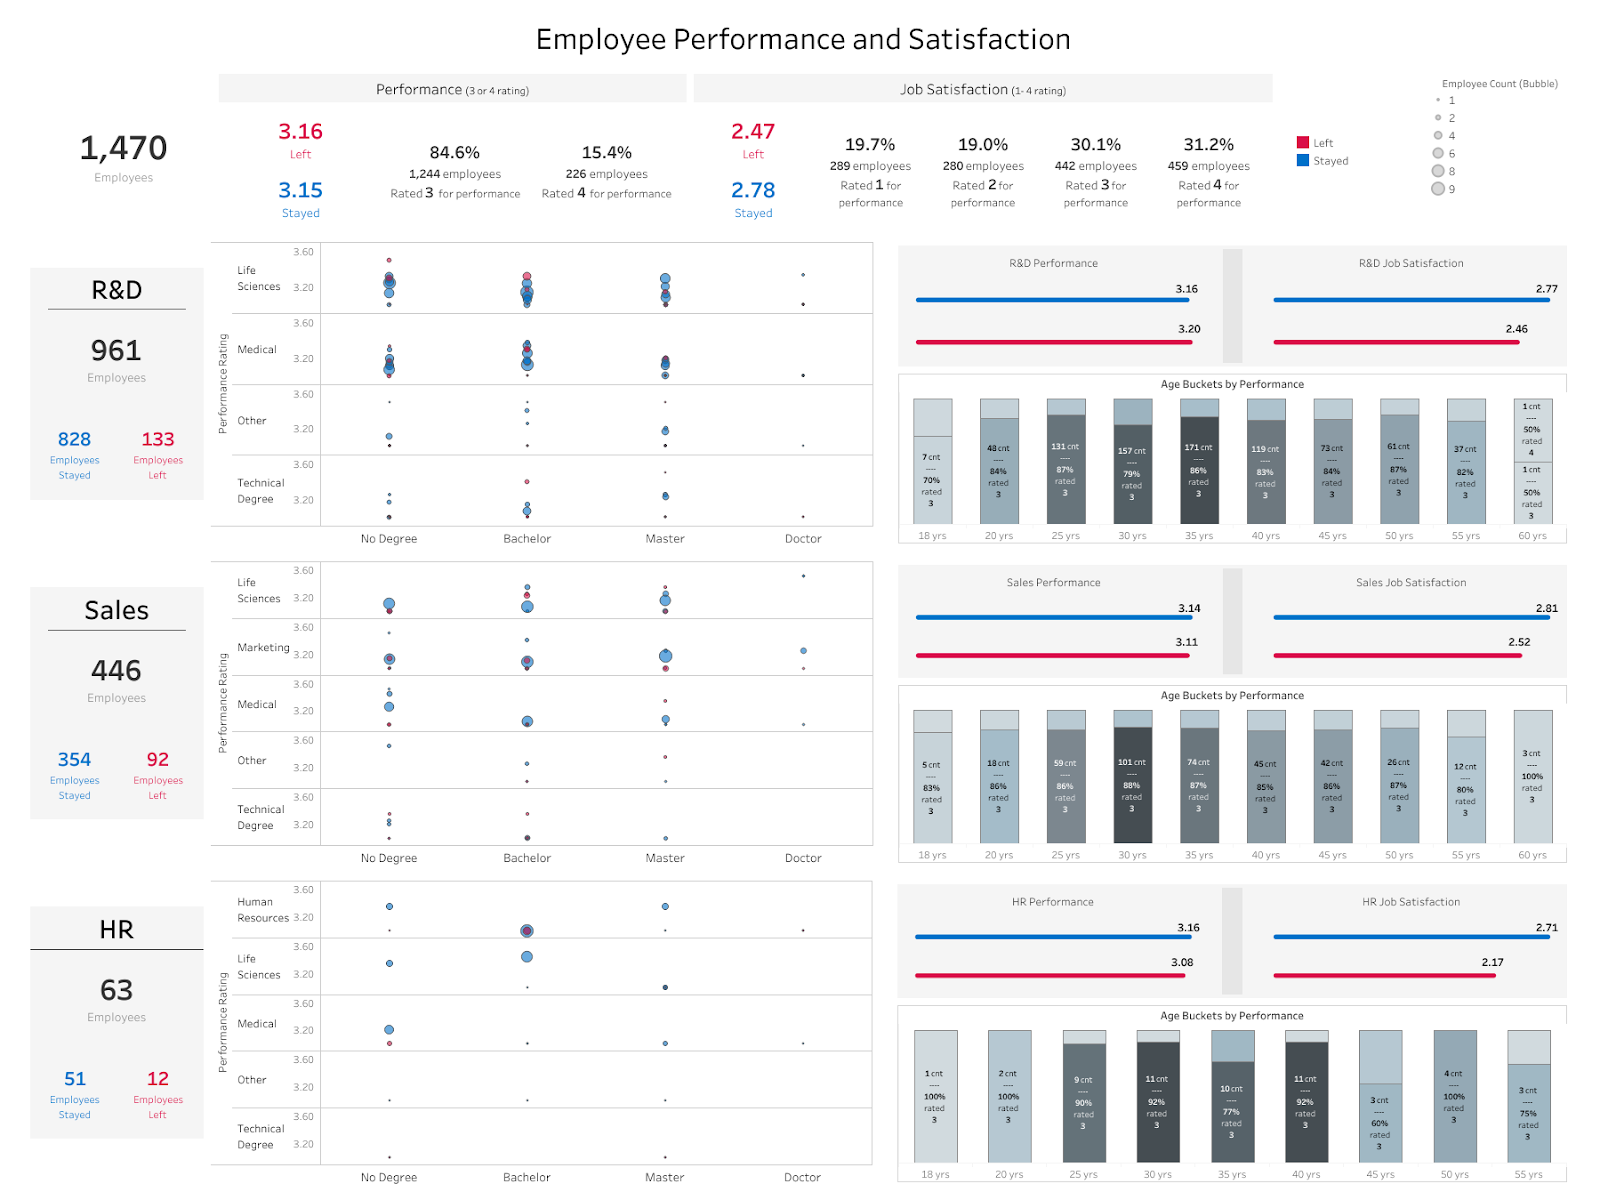
Talent Rating assesses the performance and potential of employees within the organization. It helps identify high-potential individuals who can be developed for leadership positions. By evaluating talent ratings, HR can focus on nurturing and retaining key employees, fostering growth and succession planning. The following dashboard from Omar Abbasi shows this:
Training Cost Per Employee
Training Costs are the resources allocated to employee training and development. By tracking this KPI, HR can evaluate the return on investment (ROI) for training initiatives. It helps ensure that training programs are cost-effective and contribute to enhancing employee skills and performance.
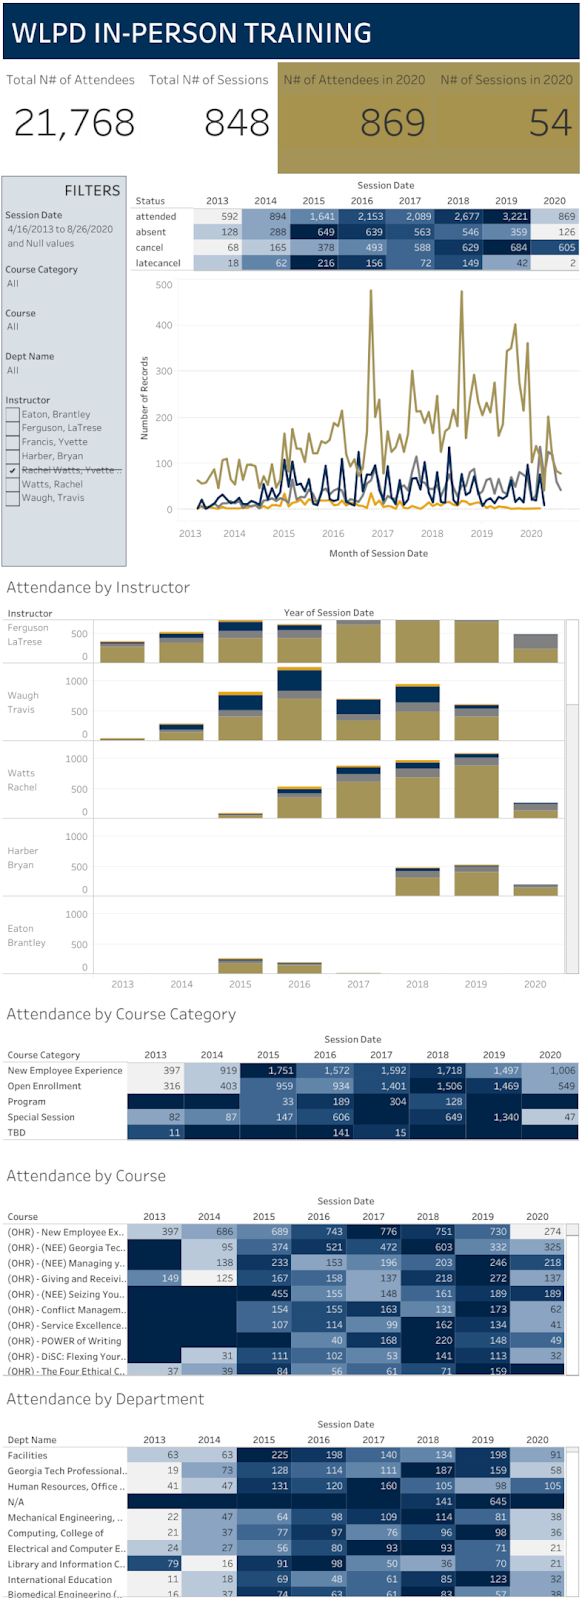
While the dashboard below doesn’t show training cost directly, it does show the trainings that employees have attended, and you can back into cost yourself with a dollar multiplier. Created by Workplace Learning & Professional Development.
Absenteeism Rate
Absenteeism Rate calculates the percentage of employee absences in relation to scheduled work hours. Monitoring this KPI helps HR identify trends and patterns in absenteeism, enabling them to address potential causes such as workload, work-life balance, or employee engagement.
Morale
Employee Productivity
Does employee effectiveness count? Overall Labor Effectiveness is a very useful, complete HR KPI that combines various dimensions into measurable data. This is typically determined by division of sales totals by employees. But to do a better analysis it would be good to think of what factors affect product production: supply and demand. Time that employees are actually working; performance / the quantity of goods delivered and final quality of the finished goods.
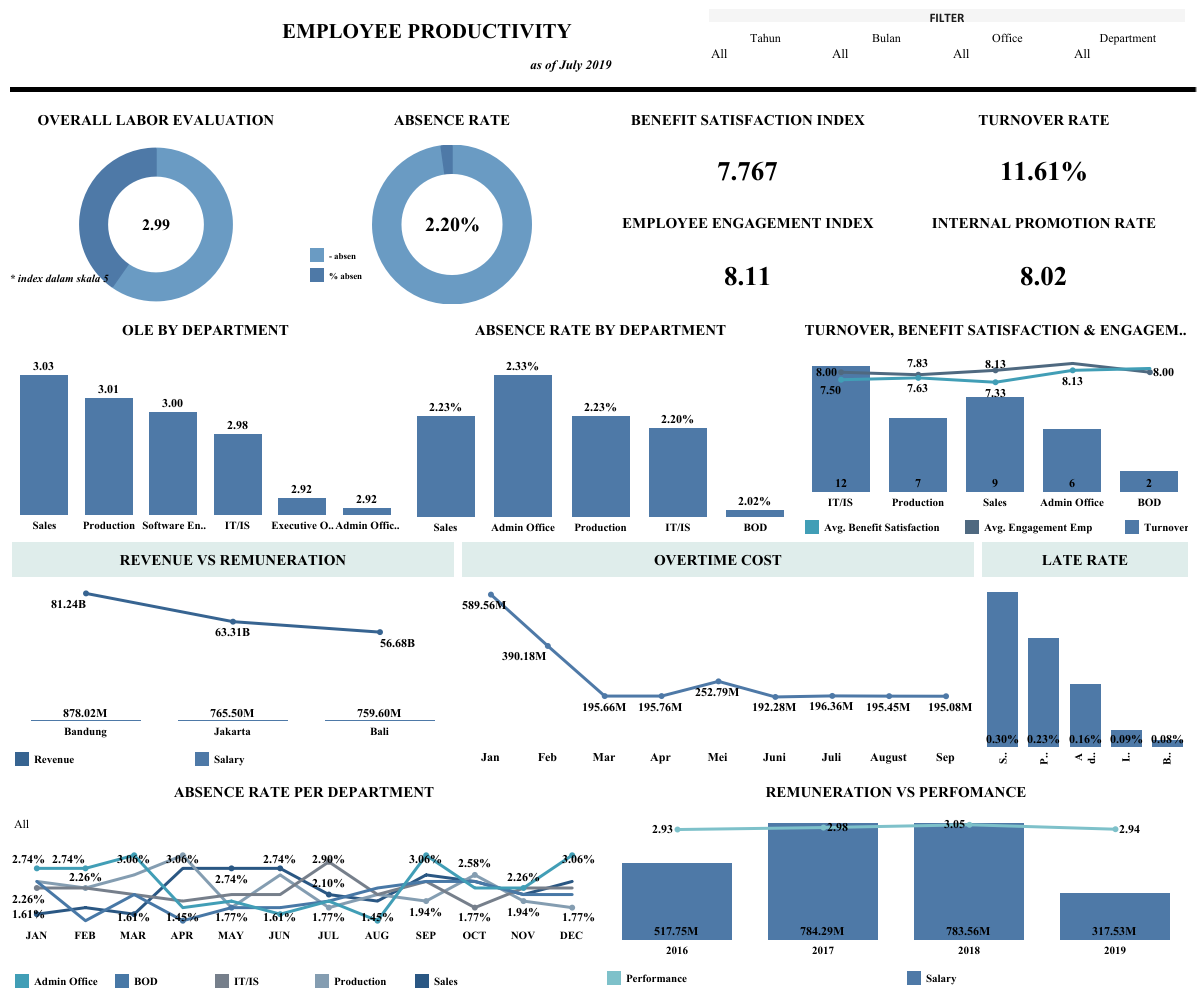
The dashboard below by Fadhila Rumi compares several HR KPIs in one view.
Talent Satisfaction
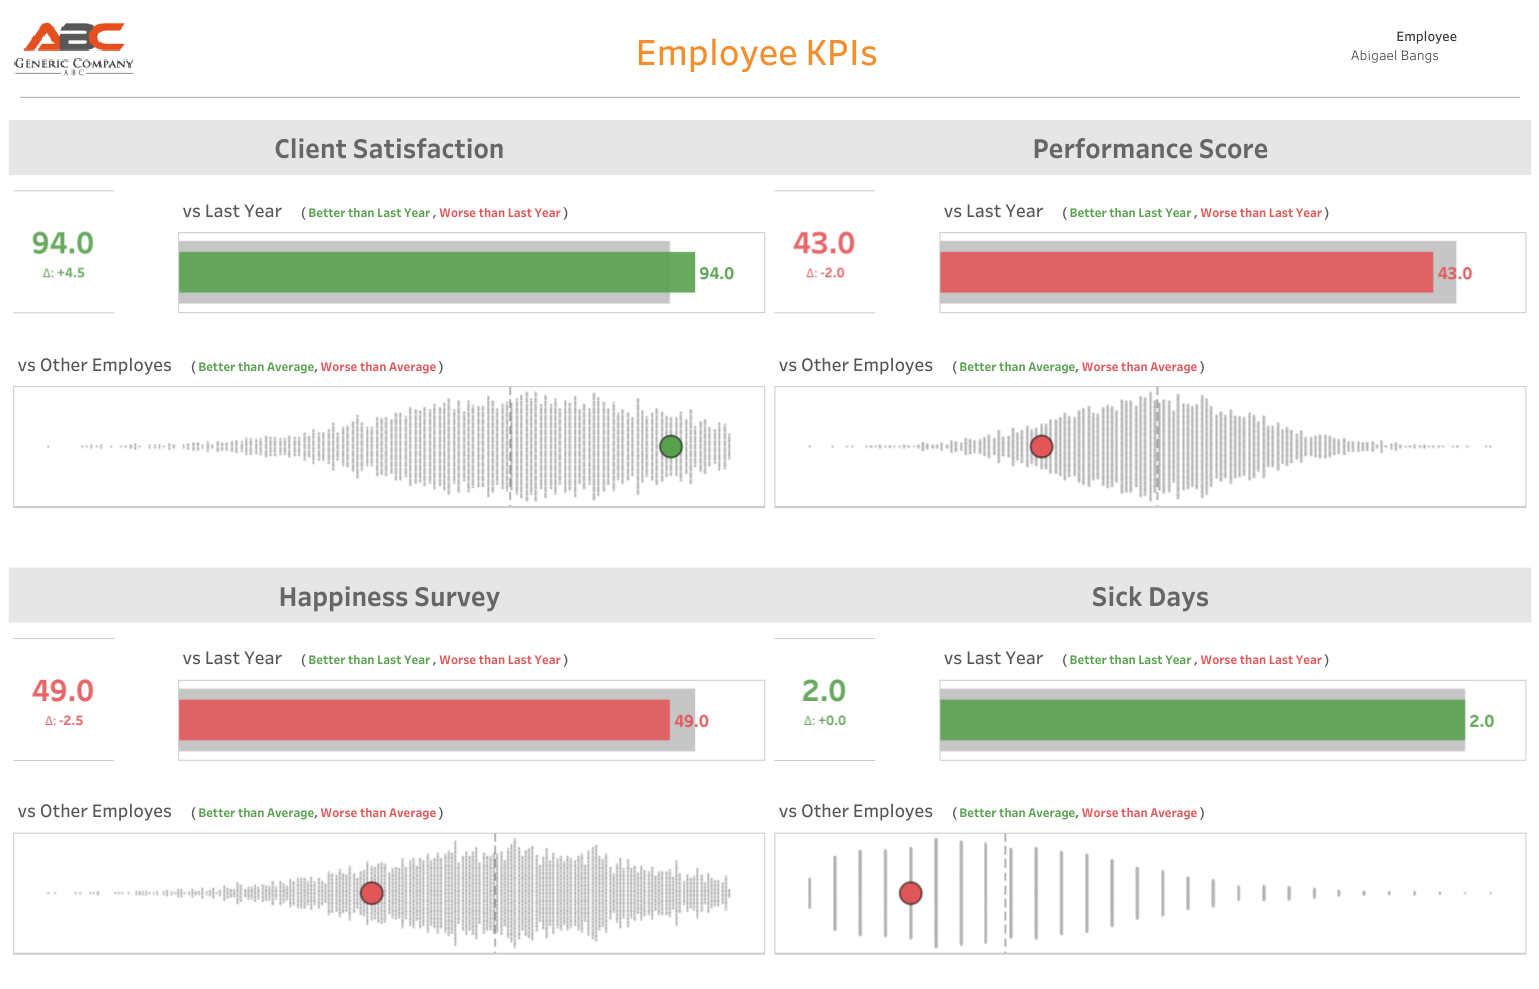
Talent Satisfaction measures how happy and engaged employees are in their roles. It helps us understand if our employees feel valued and satisfied with their work environment. Factors that affect Talent Satisfaction are work-life balance; work flexibility (hours, on-site/hybrid/remote, etc.); salary; and company culture. When satisfaction is down, improving any or all of those factors can boost morale and help retain valuable employees longer. Ideally, we find out how satisfied people are in their jobs from employee satisfaction surveys (see below), though just as often we get this info from exit interviews.
Josh Henderson shows an interesting, employee-centric view of Talent Satisfaction (“Happiness Survey” here) in the bottom-left of the dashboard below. It compares the current employee to herself in the previous year and all other employees in the chart just below that:
Also, Josh has a great viz showing pay gaps in the UK by gender and full-time/part-time here.
Employee satisfaction index
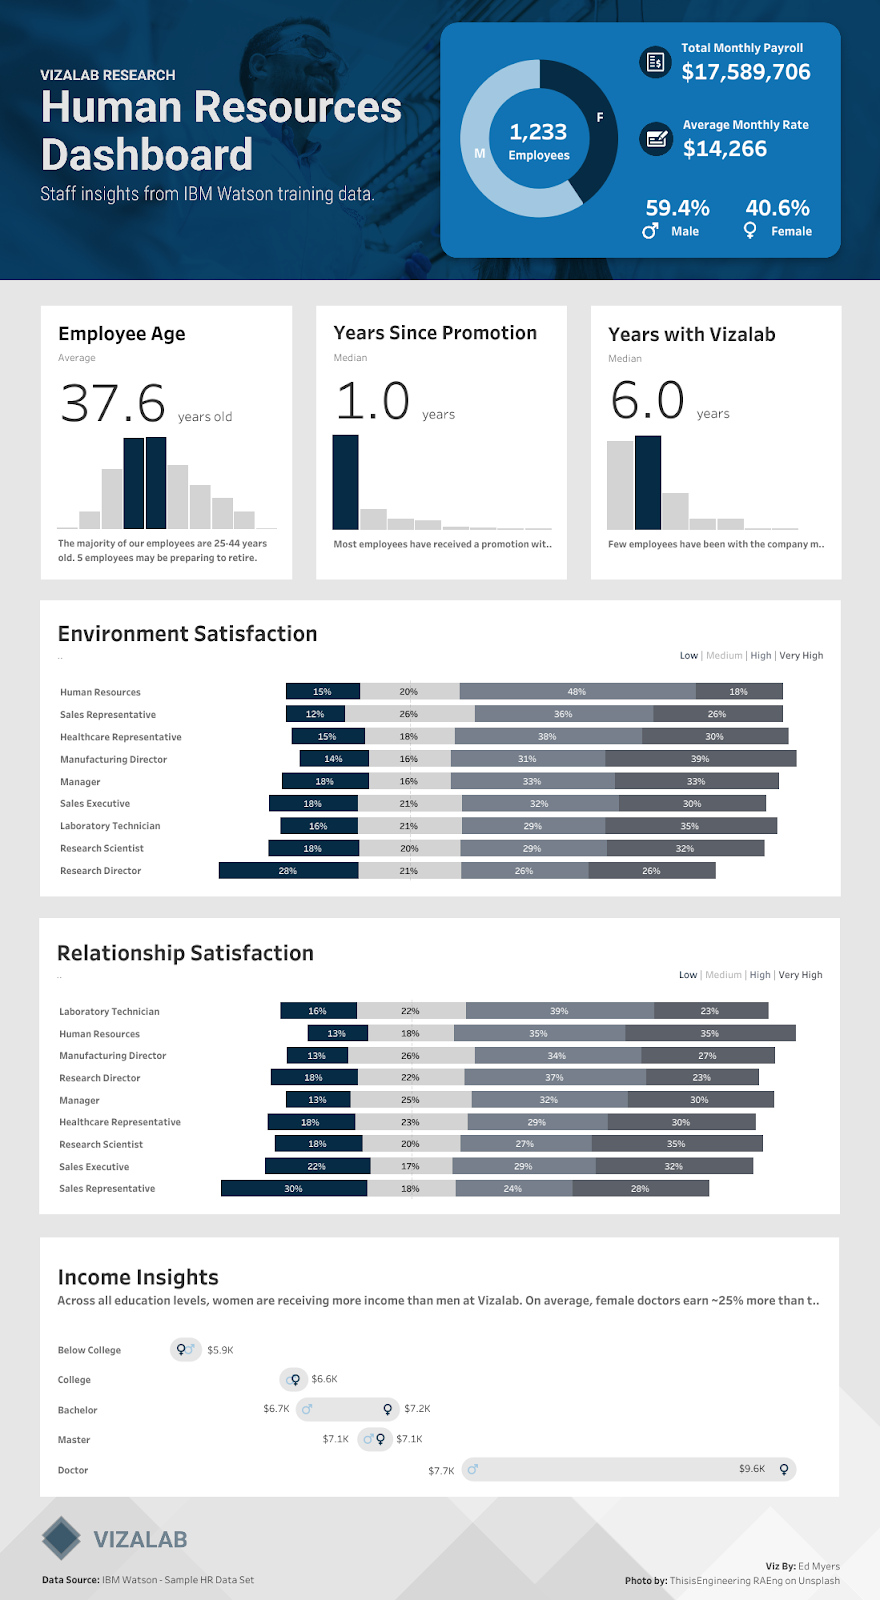
Employee satisfaction is important to measure employee satisfaction. How does it make a difference? Maintaining positive employee engagement reduces turnover. Tell me the best way to determine if a employee is actually happy? Employee satisfaction may be measured through an online interview, telephone survey and informal discussion.
Ed Myers has a lovely Employee Satisfaction dashboard here:
Employee Net Promoter Score (NPS)
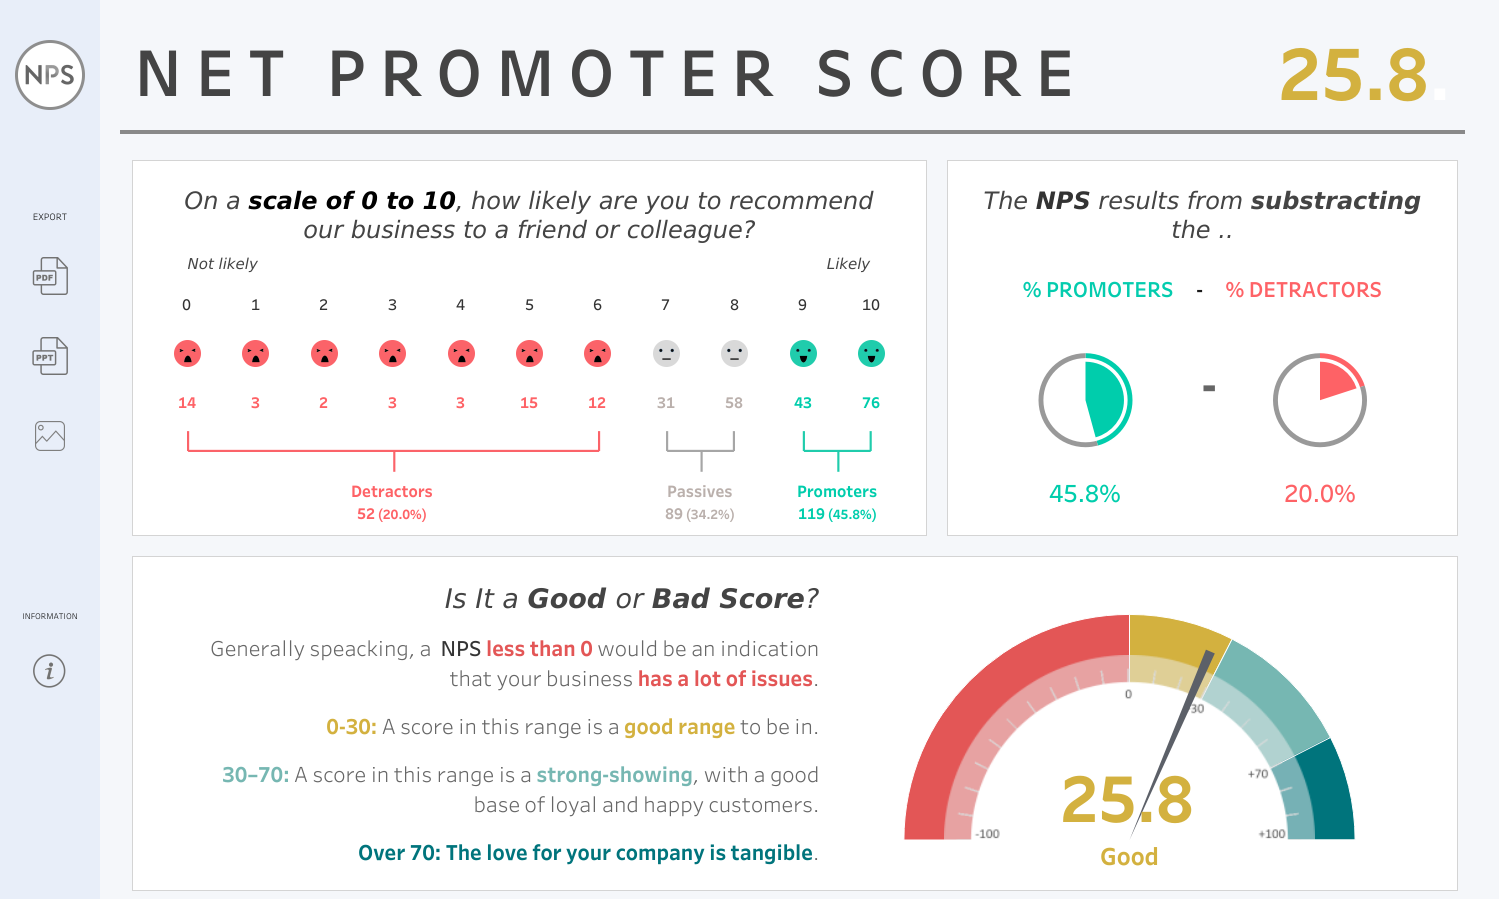
Employees of an organization act as ambassadors. The staff members are meeting clients daily and represent you to various stakeholders, ranging from clients to vendors. They can help you with marketing. You may monitor employee loyalty within a given company and measure its Net Promoter Score (NPS). Employee NPS is a metric measuring the chances that an employee recommends a firm to another. In addition, this indicates employee feelings about the company. Having good scores indicates a strong culture in the company. It helps HR professionals understand whether your employees are happy doing business with you.
The viz below by Rosario Gauna shows NPS in simple, understandable terms:
Employee Engagement KPIs
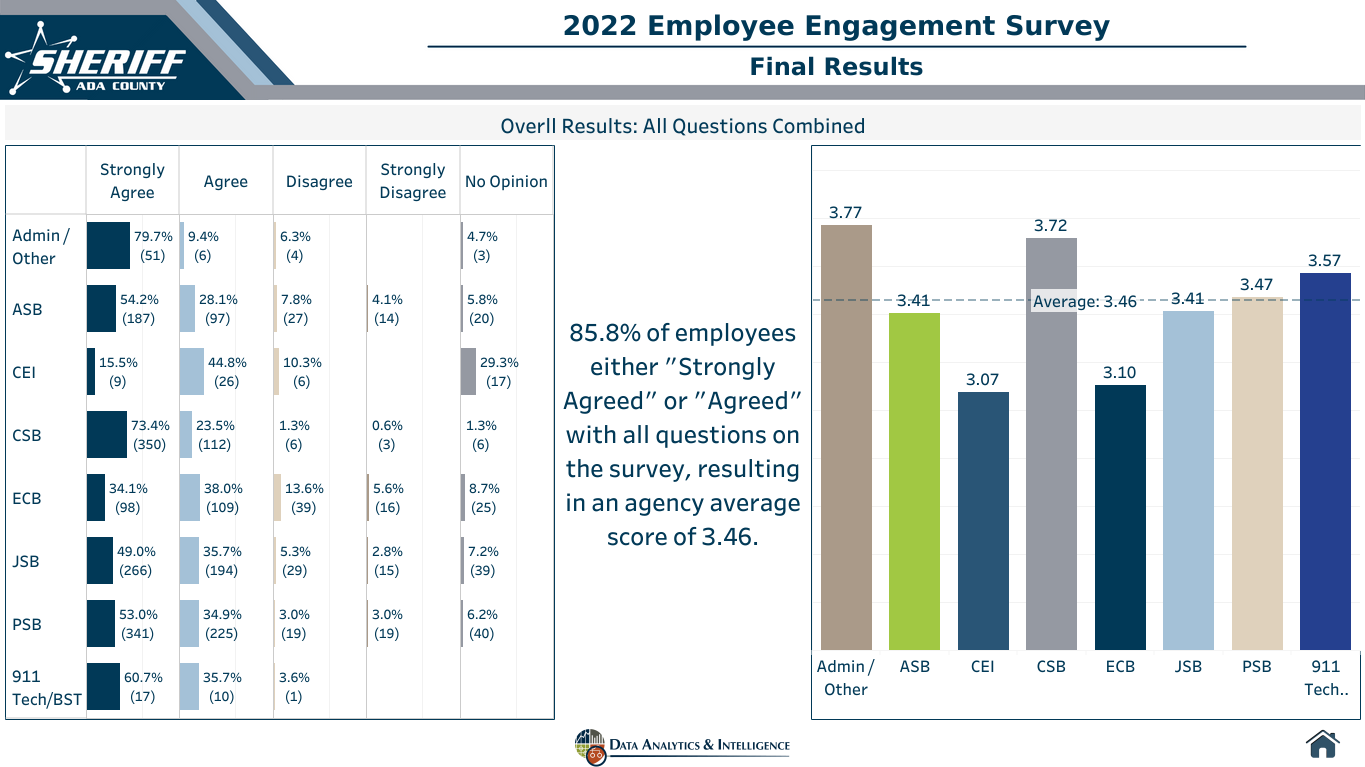
The employee engagement score enables you to evaluate how effectively you are implementing policies that encourage employee engagement. It enables a safe workplace with a suitable learning environment. This component boosts employee involvement, lowering the turnover rate. How can I know if my employees really enjoy their jobs in this way?
Viz by ADA County Center for Data Analytics & Intelligence
Healthcare expense per current employee
This measure determines whether your employees pay for health coverage and / or are covered under the health insurance policy. What’s the reason a happy employee has good health? Offering the right health insurance plan can improve employee satisfaction. You must ensure your medical provider is not overcharging you. If so then your health care provider may have lower prices or offer an even better plan for your situation. Tell me the best reliable way for calculating health costs for employees: Total health costs.
Salary competitiveness ratio
Do businesses compete with customers for business? Similarly, your employees compete against others to recruit top talent. Naturally a good job offer is another method for attracting more customers and getting more paid! The competitive salary rate reflects how competitive a business’s salaries are relative to other firms offering similar roles. High salaries give your company an advantage over its competition. It’s the saying: money talks. Tell me the calculation: salary competitive rate = Salary of your business Salary of your competitor.
A bit of an unorthodox view, but Nathan Seeley shows this by country:

HR Ops
The percentage of vacation days used
Employees KPIs focuses primarily on working-life balance. You have to give the workers plenty of vacation time to enjoy themselves. #SunOutBunsOut. Moreover it’s important for employees that they use vacation time as it boosts their productivity. How should we estimate vacations? % used = number of holidays used x 10000.
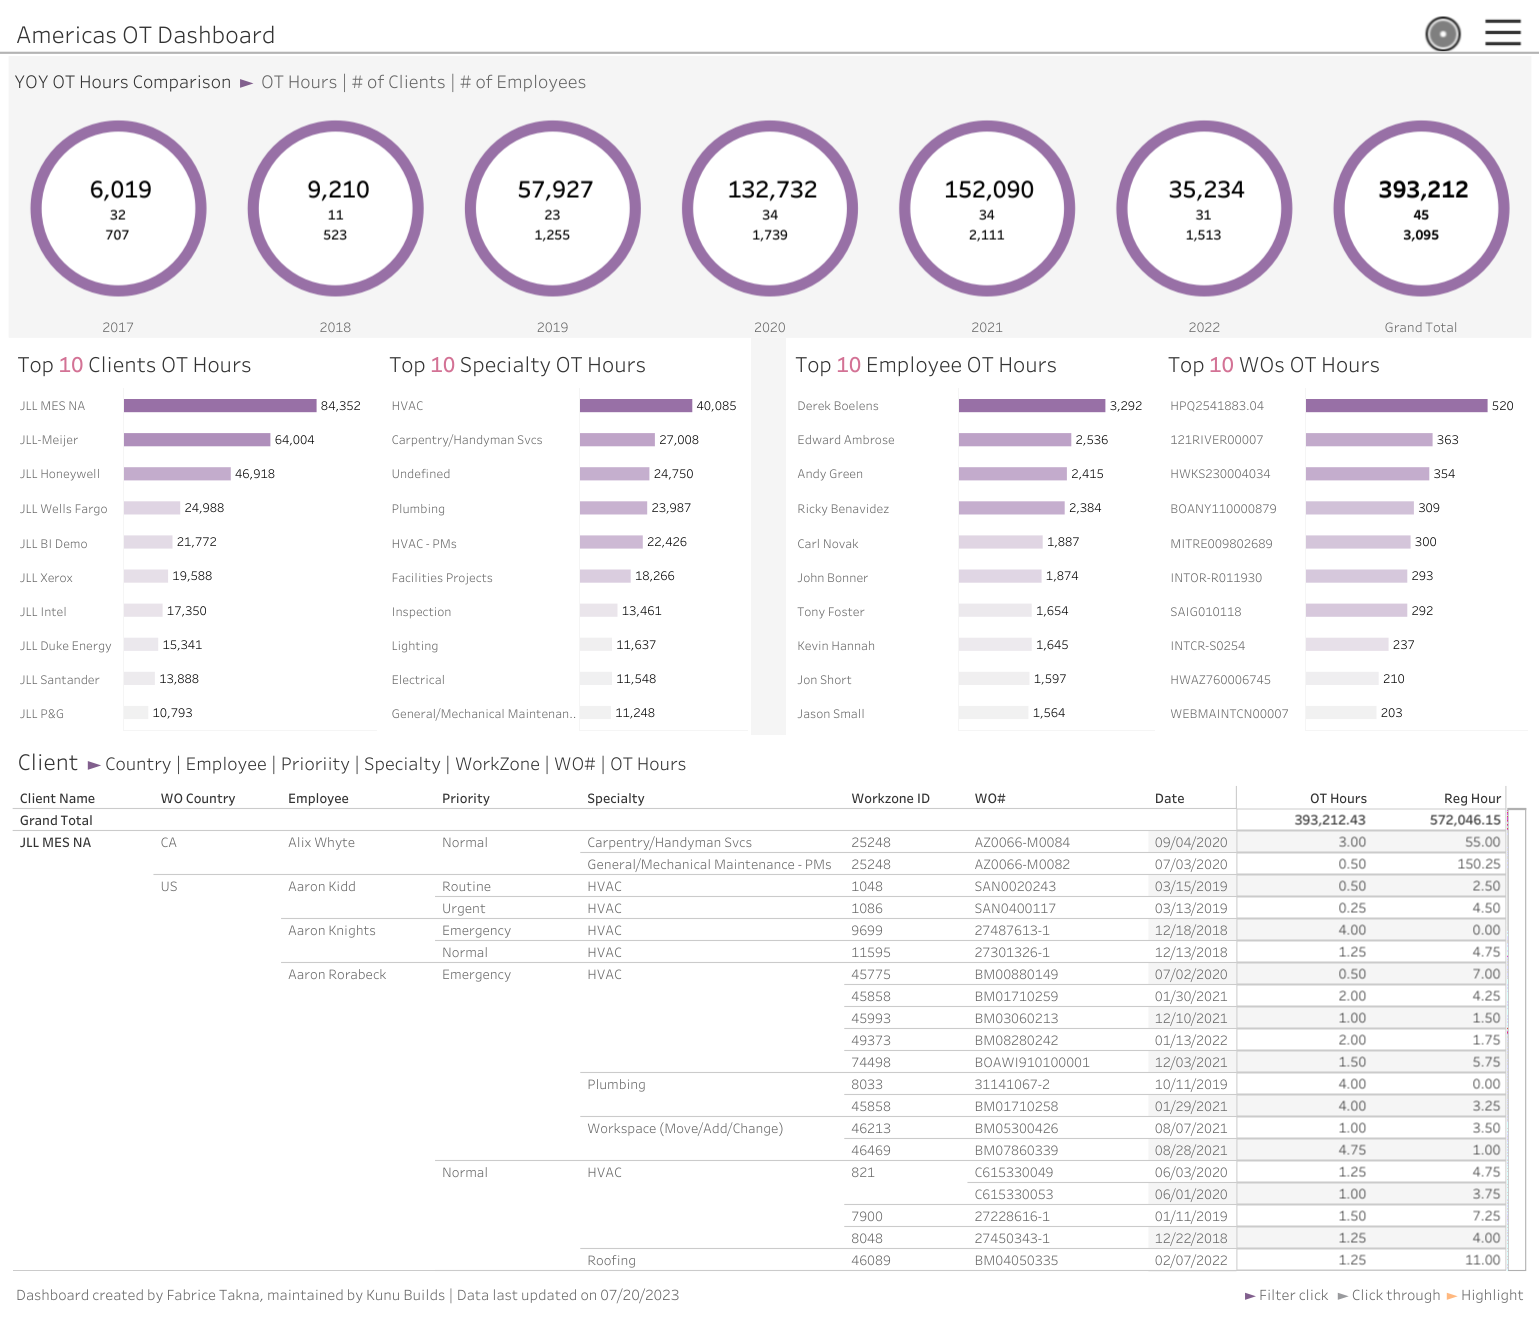
Overtime Hours
Can I check my employees’ workloads? Overtime hours provide many useful indicators and may have different interpretations depending on context. A sudden increase in overtime may result in heightened orders, or a more stable economy. This can prove the dedication of our workforce and the shortcomings in the processes or an understaffed workforce that will face a lot of pressure. It will also affect another HR metric we saw earlier namely absenteeism rates. Sometimes the easiest way to remove stress (and increase employee productivity) is to increase the group’s headcount (its total number of employees). This doesn’t always work, but it can also encourage business growth, so it may be a good bet for a company or division that’s expanding and doesn’t want to turn down work.
The dashboard below (link here), originally developed by Fabrice Takna, shows employees’ overtime by project and year.
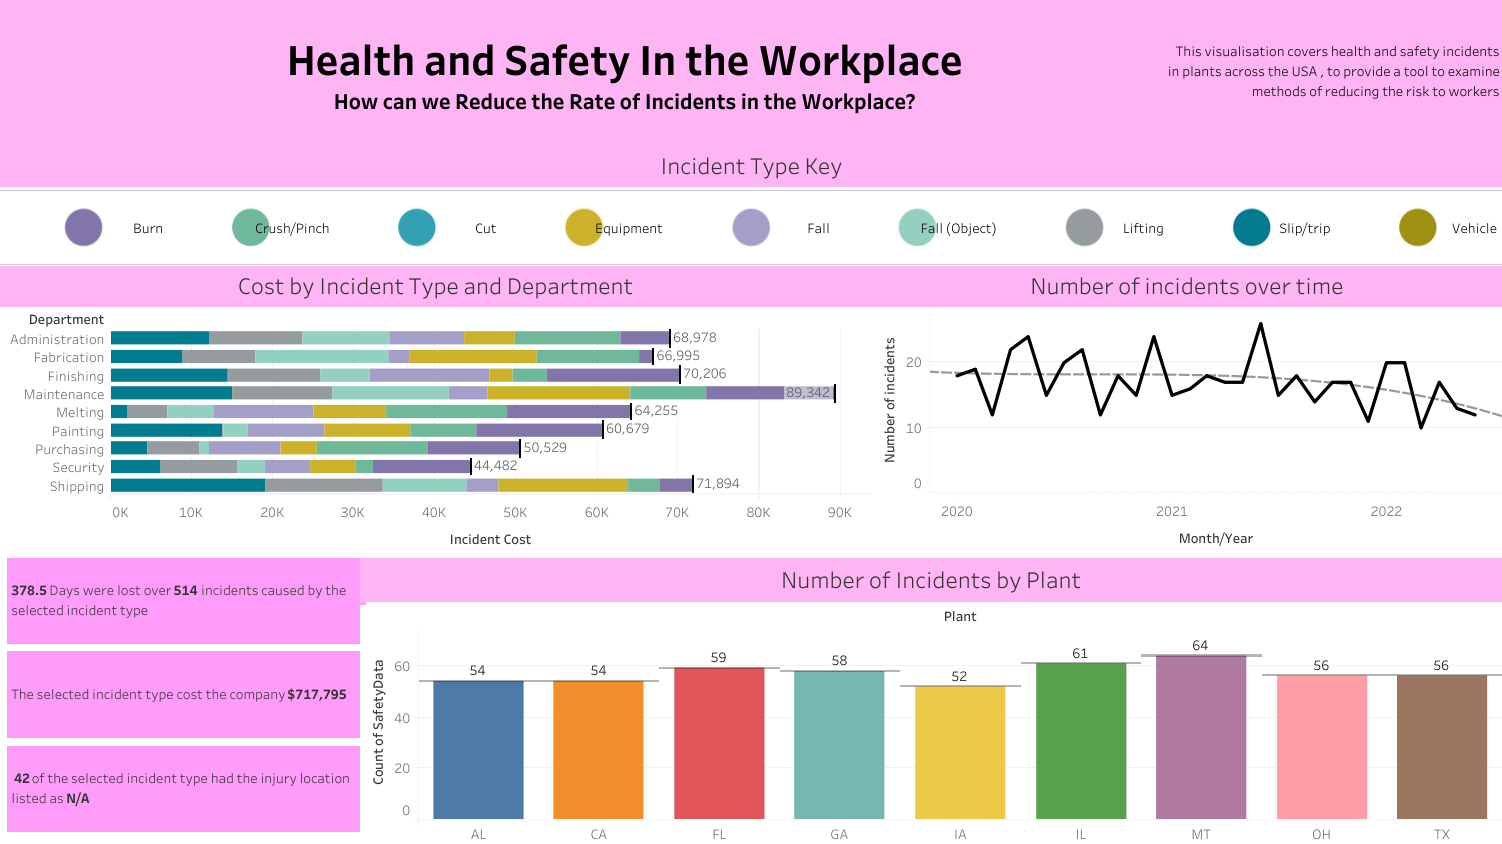
Workplace Accidents
An workplace accident can become a nightmare for any HR department. Workplace injuries can be cited as the major cause of absenteeism among employees causing increased costs and lower productivity. You can determine these statistics by the number of workplace injuries in the given period. It reveals the level and safety of your work environment and employees. This can also be helpful when evaluating the potential improvements. What safety precautions are needed? Is it possible to prevent a workplace accident from happening? This metric needs to be tracked regularly to determine areas for improvement.
Phillip Davies shows Workplace Accidents well in the dashboard below:
Company Make-Up
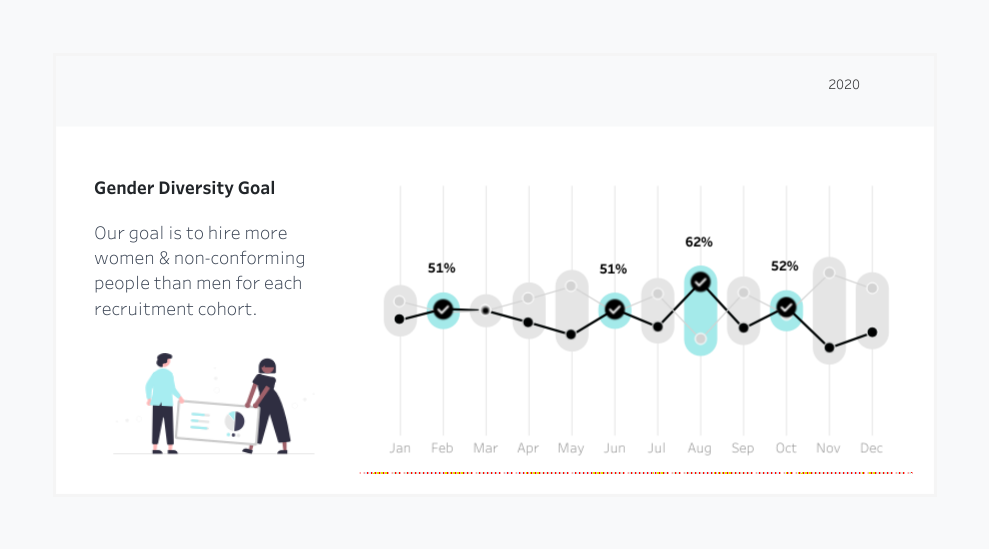
Gender Diversity By Role
Gender Diversity by Role measures the distribution of males and females across different job levels and positions. By examining this KPI, HR can identify any gender disparities within specific roles or departments, and work towards achieving equal representation at all levels.
Gender diversity can be as simple as Ludovic Tavernier shows over time here:
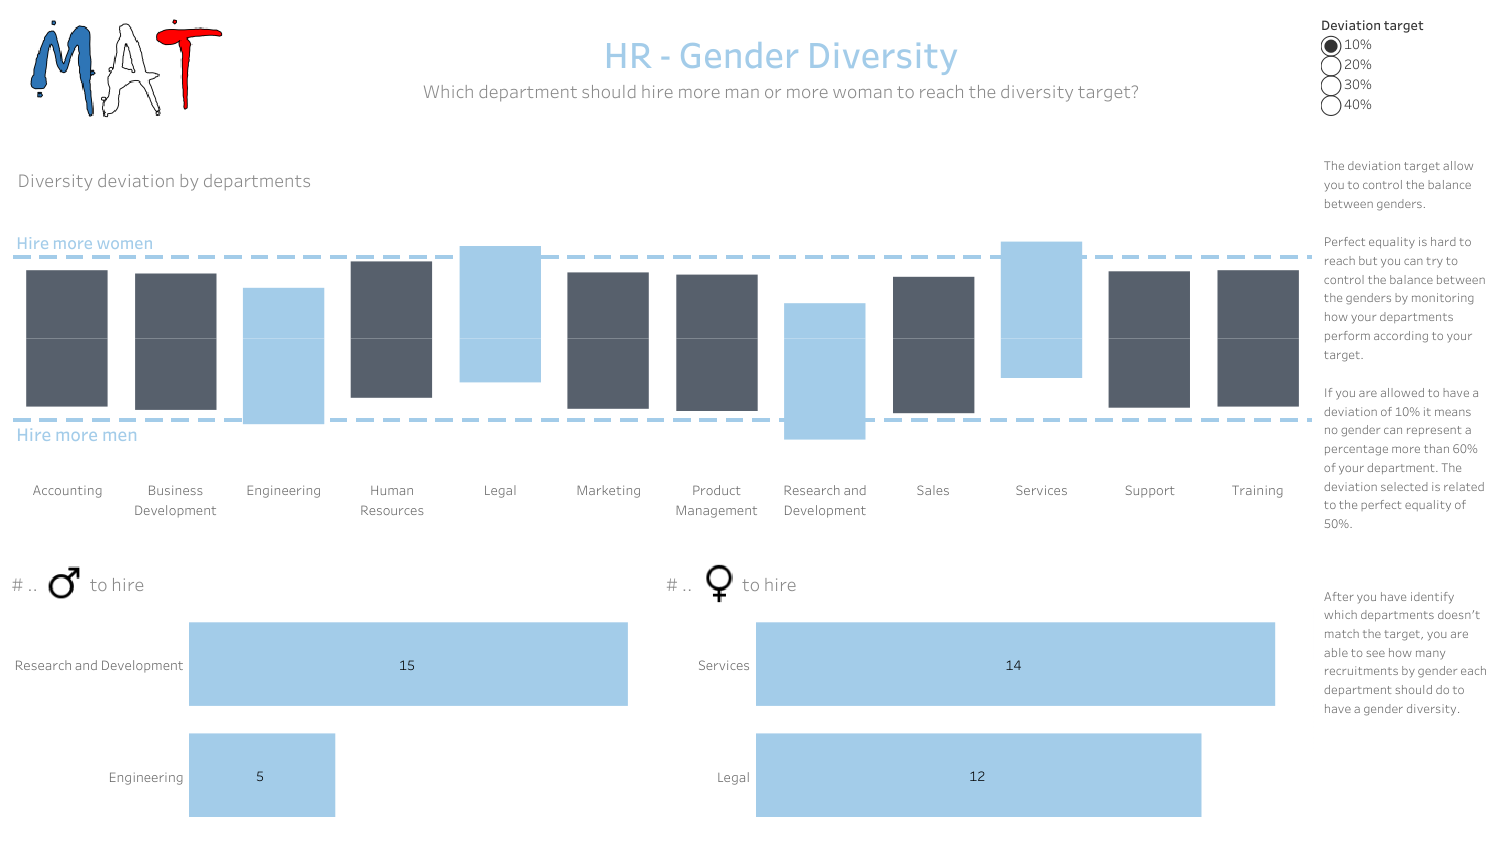
… or the breakdown can be a little more complex, with departments broken down by gender and their associated targets, like Mathieu Fontaine does here:
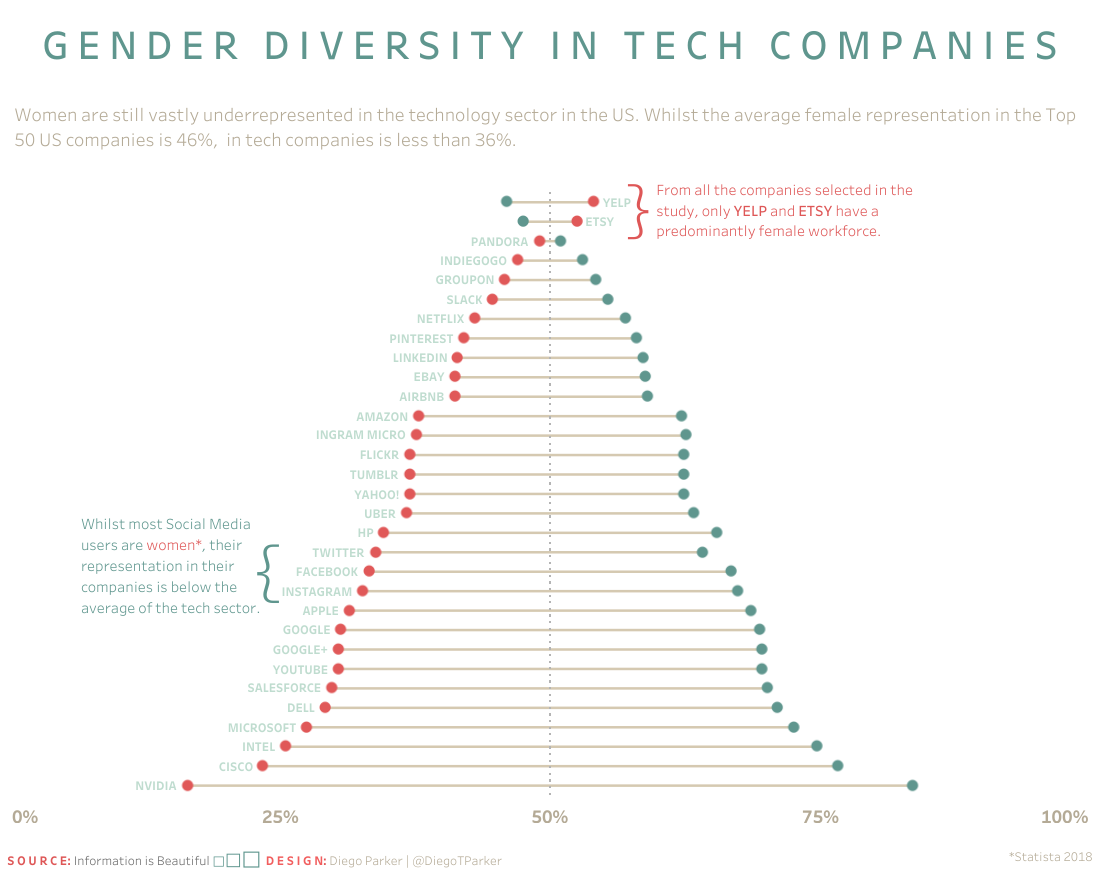
Finally, if you want a beautiful (though not actually good) view of the gender split at tech companies, Diego Parker made a work of art here:
Ethnicity Diversity
Ethnicity Diversity is the mix of different ethnic backgrounds within the organization. It helps ensure a diverse and inclusive workforce, fostering a richer exchange of ideas and perspectives. By embracing diversity, organizations can tap into a broader talent pool and enhance innovation.
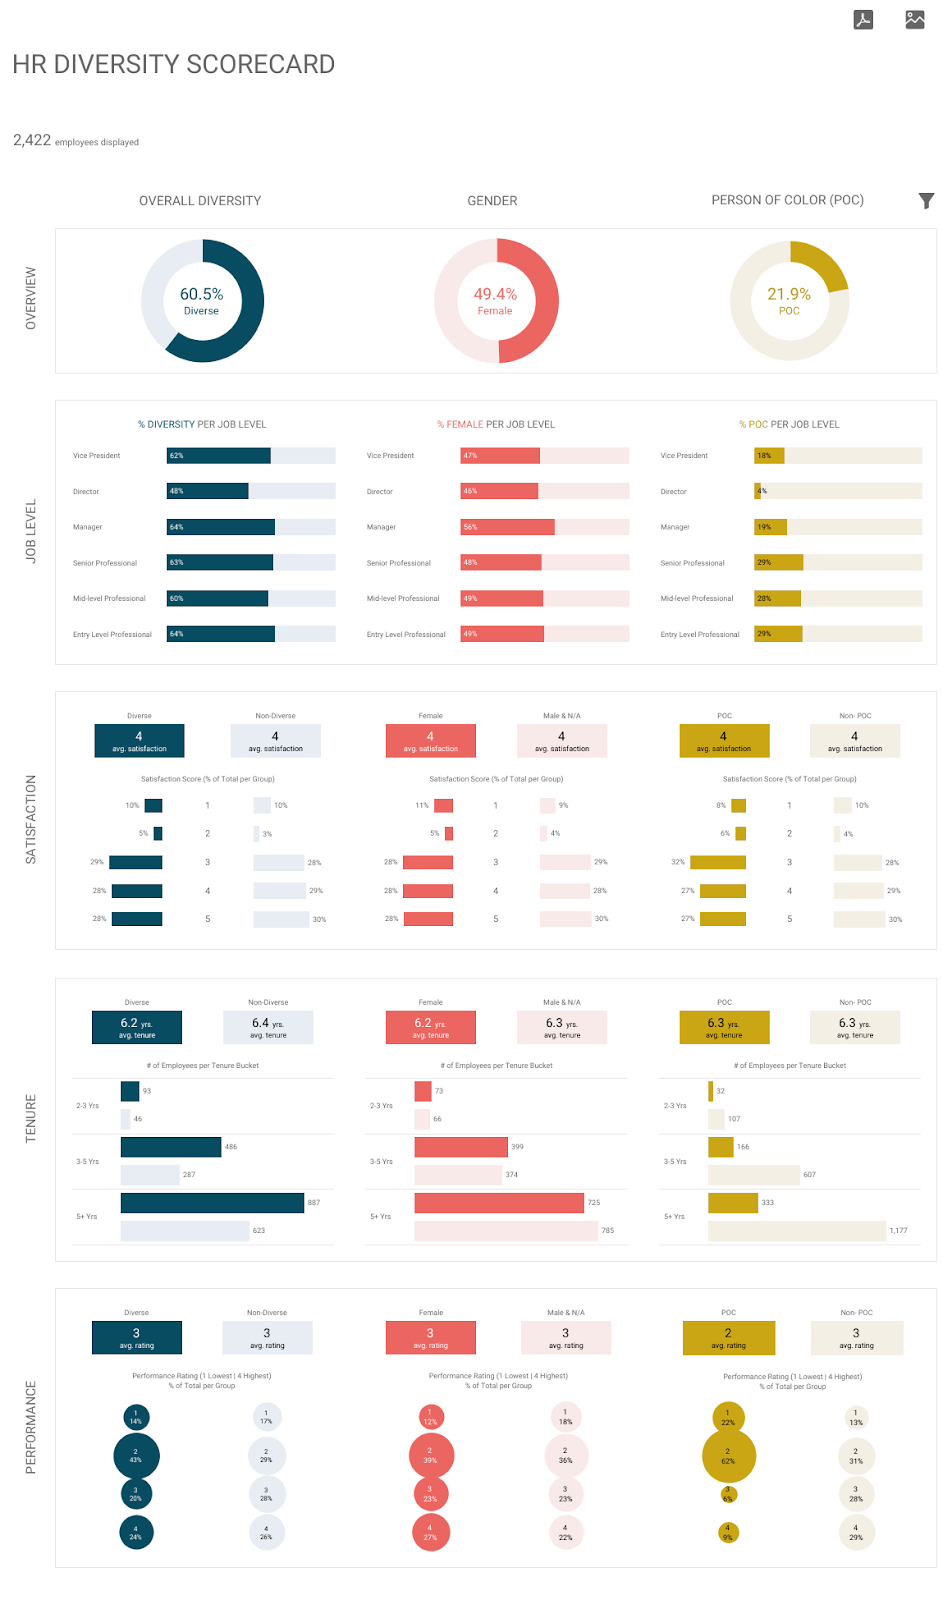
The dashboard below (by Lovelytics) is a simple and elegant representation of a company’s diversity.
Recruitment Breakdown by Ethnicity
Recruitment Breakdown by Ethnicity measures the distribution of applicants from various ethnic backgrounds at each stage of the recruitment process. Monitoring this KPI allows HR to assess the effectiveness of diversity initiatives, identify potential biases, and implement measures to ensure fair hiring practices.
Part-Time Employees
How are the part-time workers treated? Part-time workers typically work about 40 hours a week compared to full-time workers. Part time jobs provide numerous advantages for the start up of companies. Many people have the option to find part time jobs since they fit the need better.
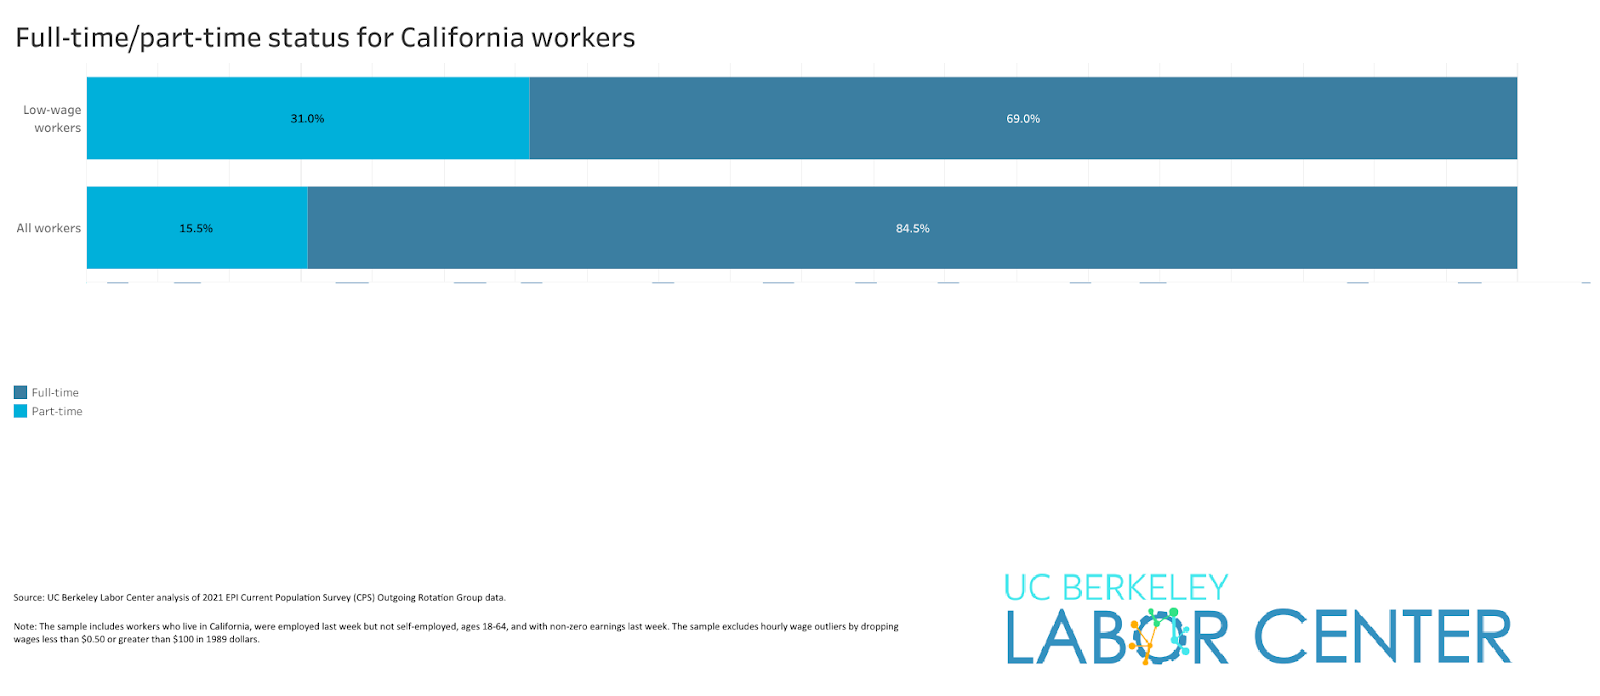
While not the prettiest view, the UC Berkeley Labor Center put together its ratios of Full-time to part-time workers in this view:
HR to Employee Ratio
HR employee ratios are critical HR metrics measure how HR staff compare to total employees in an enterprise if they are equal in terms of numbers. It provides insights about how efficient HR is in managing and assisting its employees. A lower HR employee ratio indicates a lack of staff or a lack of resources to provide for the employees and will result in lower quality and lower employee satisfaction. On the contrary, the lower HR/employer ratio indicates that HR departments are understaffed, thereby resulting in unnecessary expenses. Calculated formulas:
Learning and growth goals
The goals will help you create a skilled team. Your staff needs to develop so that they no longer need training! A BSC encourages your employees to devote time and resources to activities based on their business objectives. It shows your employees’ value.
Attrition: Terms and Leavers
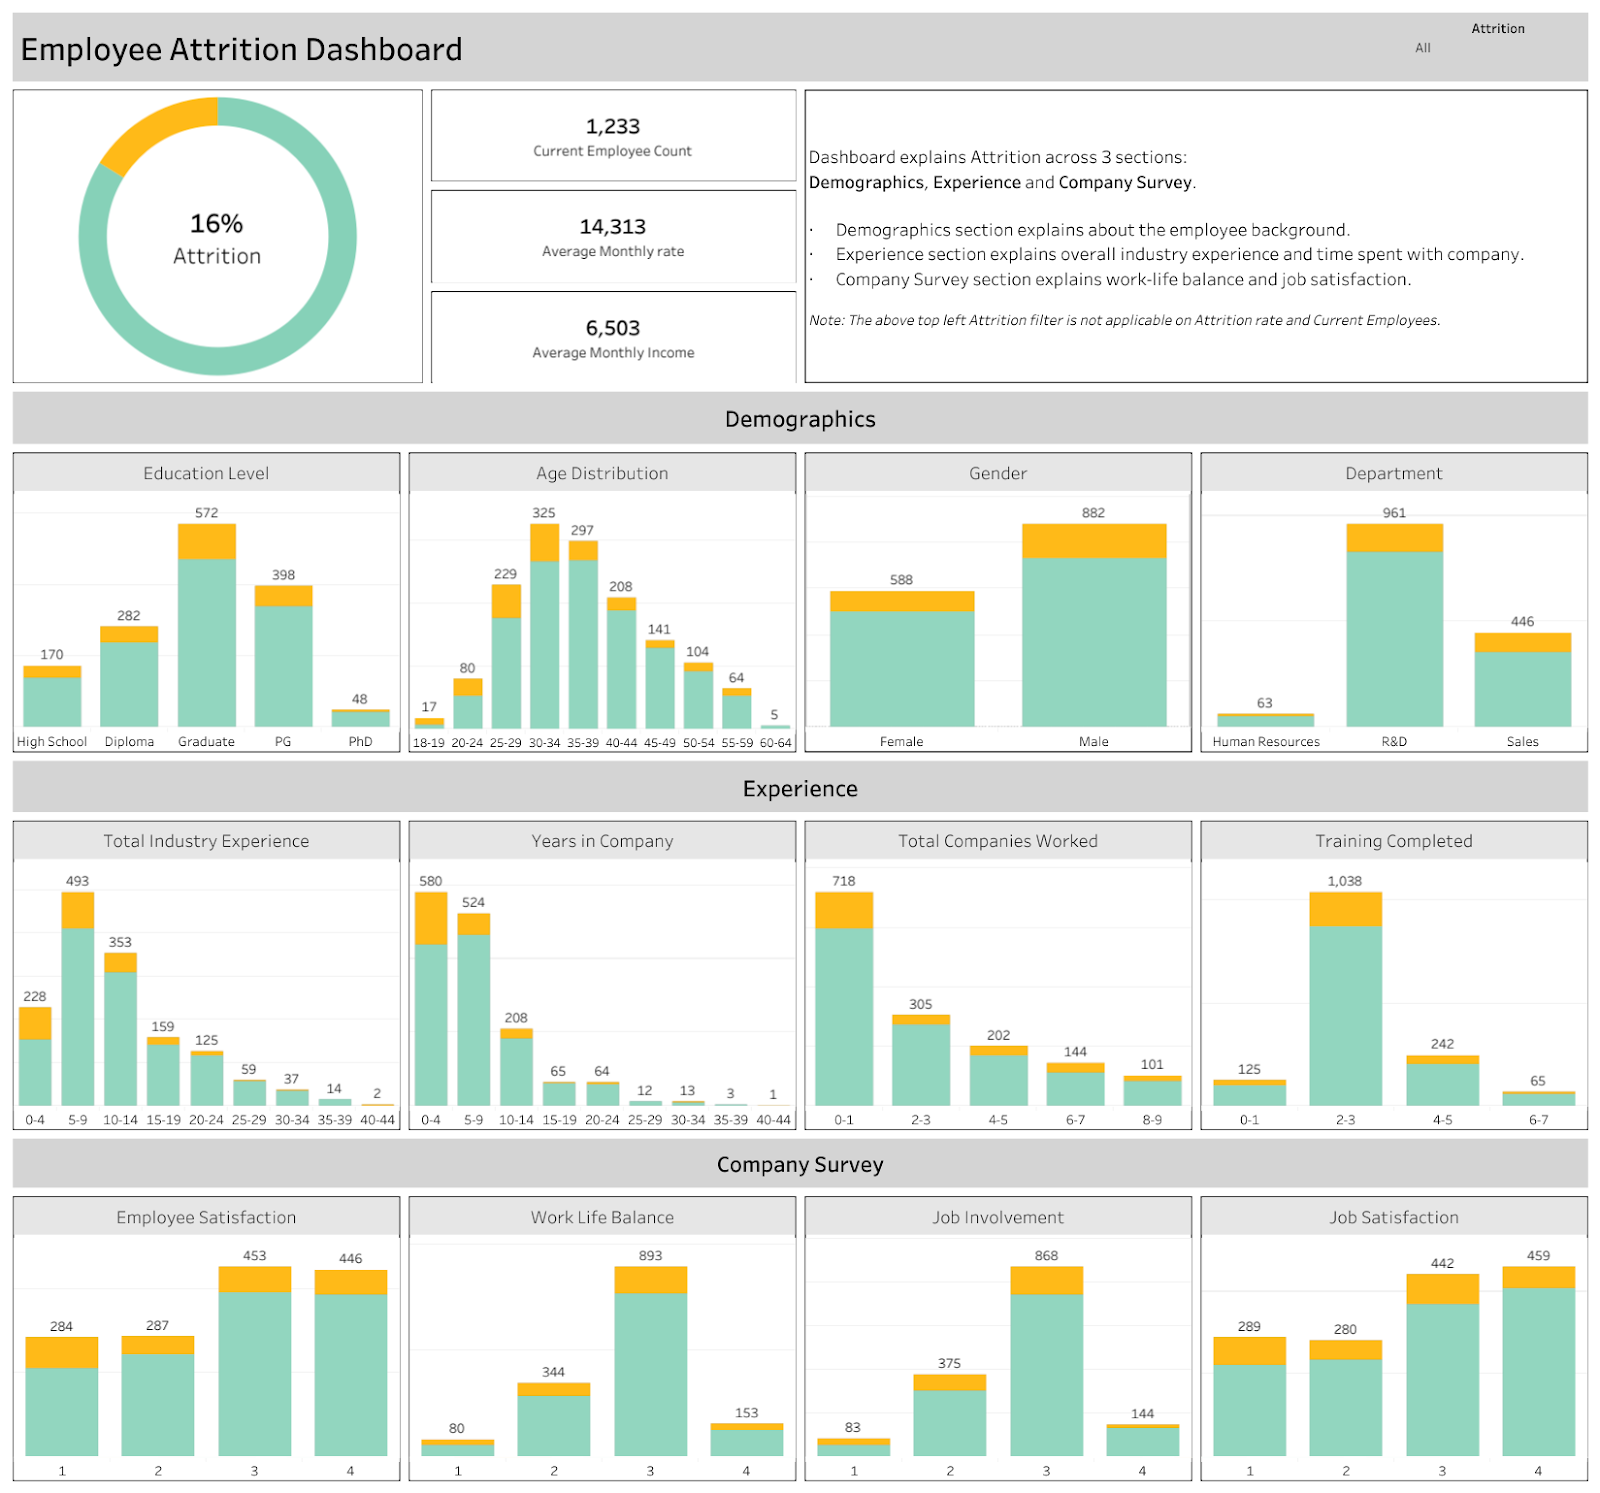
Attrition
Attrition is a way of measuring the change in size of the organization. It’s calculated as the total number of leavers (on their own or those who are dismissed) in a time period divided by the average headcount in that period. Attrition is only concerned with how many employees leave. Unlike Dismissal Rate, it doesn’t care about why. When attrition is down, things are stable. When it’s up, things can feel really uncertain.
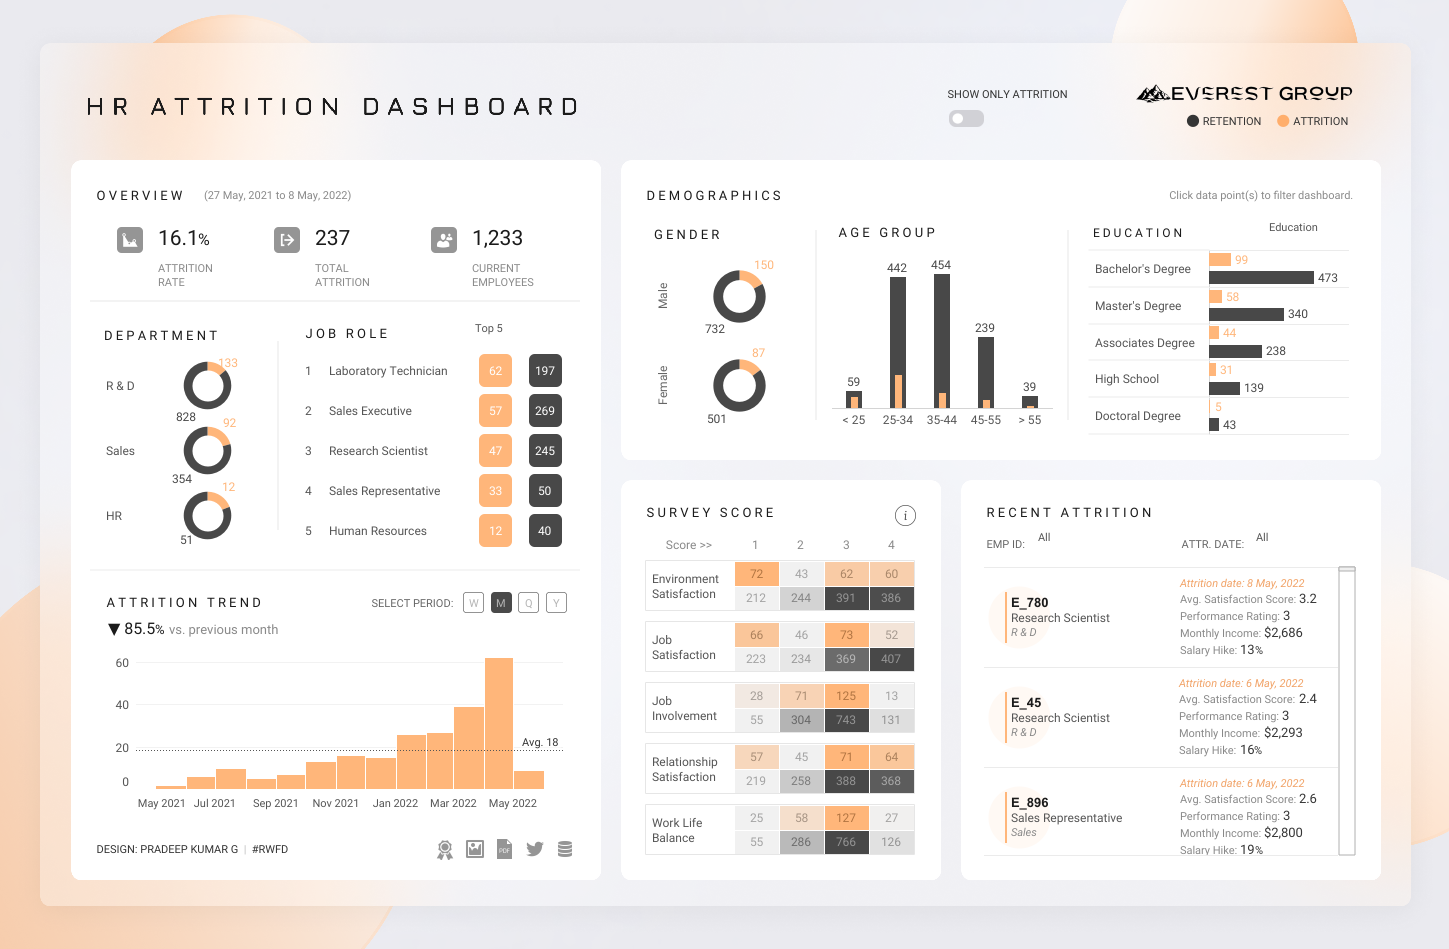
The attrition dashboard by Pradeep Kumar G shown below is absolutely beautiful.
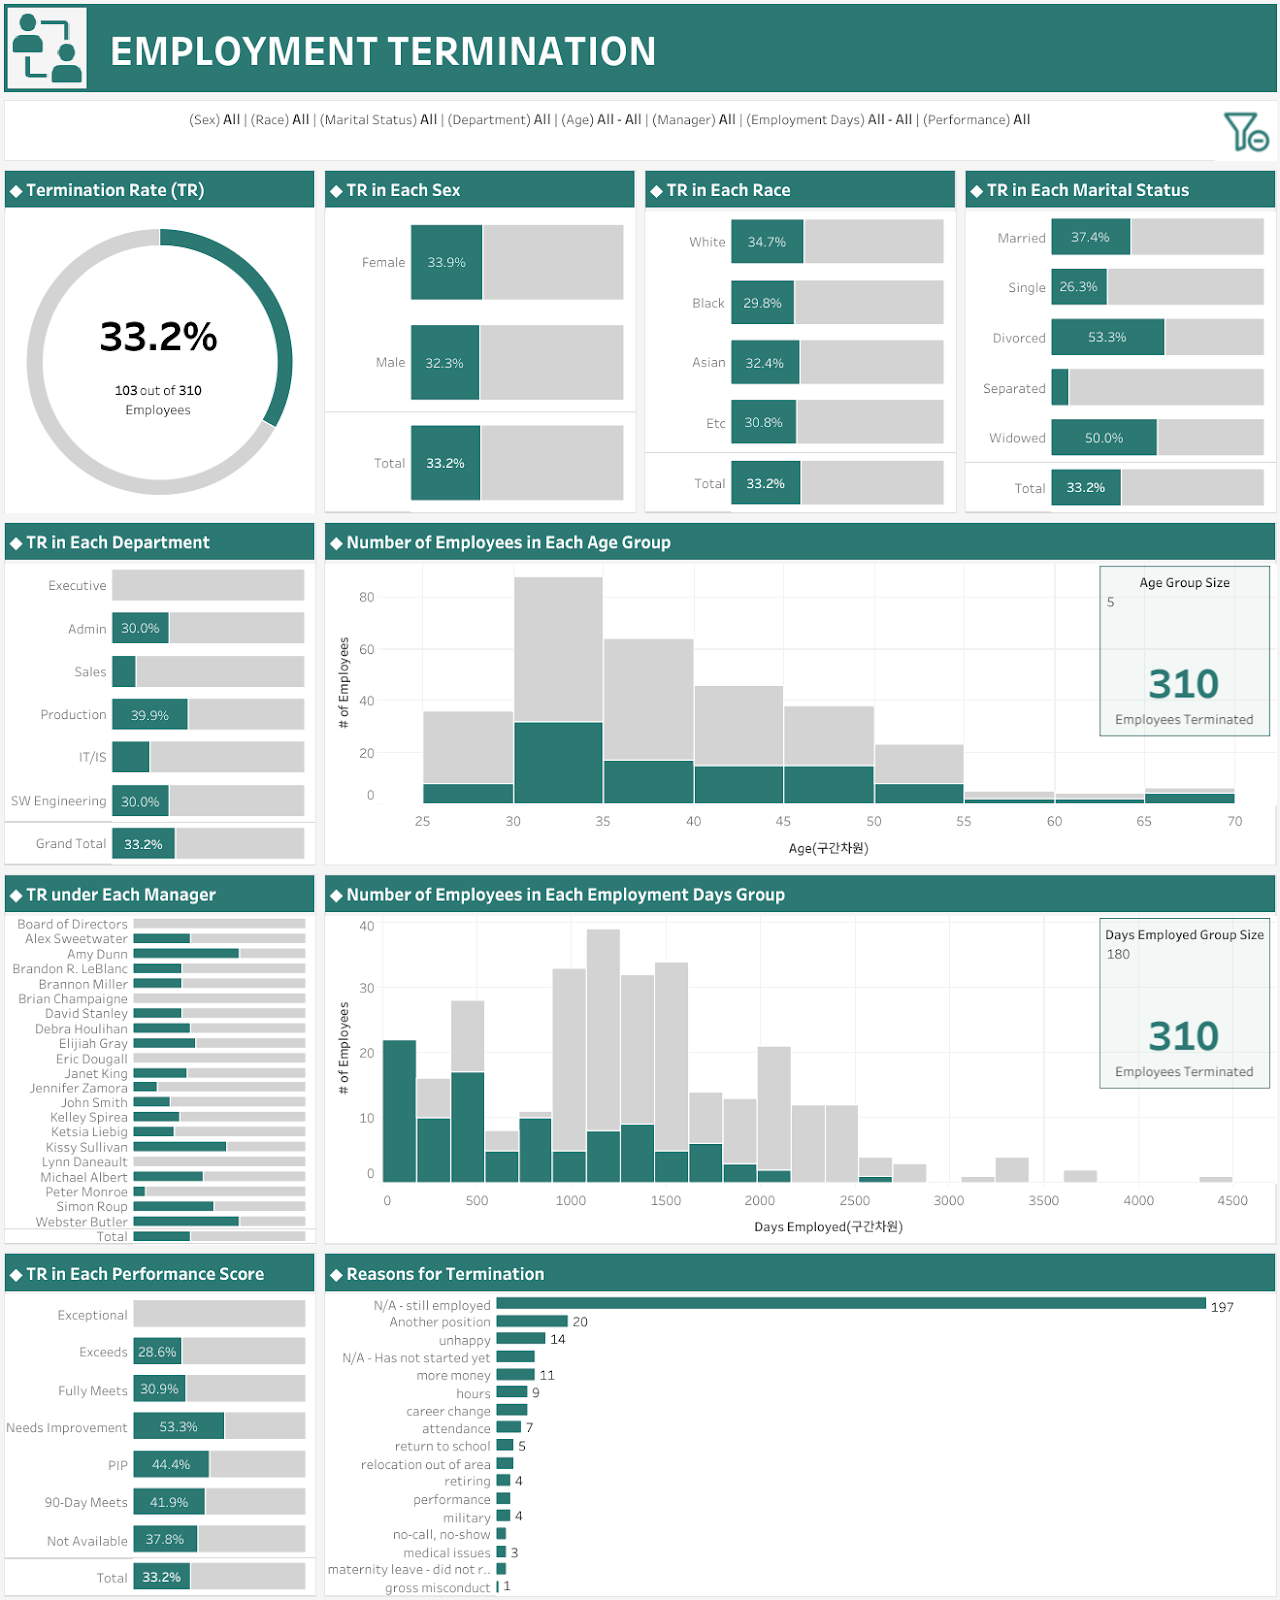
Dismissal Rate/Terminations
Dismissal Rate is the percentage of employees who are terminated out of all leavers. Monitoring this KPI helps HR understand the effectiveness of performance management practices, identify potential issues, and ensure fair and equitable treatment of employees. When term rates get too high, it can really start to affect company culture and workers’ morale. With all of the layoffs of late, plenty of tech workers have likely felt this recently, too.
We love Jungmin Choi’s Terminations dashboard here:
Employee Turnover Rate
Employee Turnover Rate calculates the percentage of employees who leave the organization over a specific period. High turnover rates may indicate issues such as low job satisfaction, poor management, or inadequate training. Tracking this KPI helps HR identify trends and implement strategies to improve retention and reduce turnover costs.
Charlotte Murray shows this well in the bottom-left corner of her HR management dashboard here.

Talent Turnover Rate
Talent Turnover Rate specifically measures the departure of high-performing or high-potential employees. It is crucial to monitor this rate as losing top talent can impact productivity, team dynamics, and overall organizational success. By addressing the factors contributing to talent turnover, HR can implement targeted retention strategies.
Employee retention rate
Employee retention rates measure how much time you’ve saved to retain top performers. It involves practice and strategies whose goal is to ensure the success of your workforce. In some cases, motivation can be achieved through recognition or awards. The HR measure helps the company learn how people choose the job. So a firm may be more prone to paying more than it can afford in recruiting a new employee for an additional salary. What are best talent retention rates?
Average Time Stay
Average Time Stay calculates the average duration an employee remains with the organization before leaving. Tracking this KPI helps HR understand employee loyalty, engagement, and the effectiveness of retention strategies. Longer average time stays indicate higher job satisfaction and stronger employee commitment.
Akshay Netalkar shows this well in the “Experience” section of this dashboard:
Tying It All Together
Now that we have all of our HR KPI in one place, how do we tie them together? As you may have noticed, it’s not practical to make a dashboard for every single metric. So many of them depend on each other, and some of them are independent; there’s nothing we can do to change them. That said, there are usually KPIs that depend partly on those independent metrics and partly on levers we can pull to change things.
So, what is an HR manager to do? You build views that show the dependent and independent KPIs on the same dashboard. Want to see why recruitment costs are so high? Then you likely need to show Time To Fill and your Offer Acceptance Rate (along with your Salary Competitiveness Ratio). Why? Because Time To Fill and Salary are both very important levers that you can pull to affect change. And knowing what you need to change is the first step in so many HR strategies.
Similarly, if you want to know why attrition (a dependent HR KPI) is high, you need to look at the metrics it relies on. Because there can be many reasons for increases in employee turnover, it can help to have flags on a dashboard, so that the user knows what to focus on (something that we’ll talk about in an upcoming series on dashboard development). Are your employee satisfaction surveys coming back low or your Employee Net Promoter Score is down? Then dive into why morale is down. It could be salary, crazy overtime hours, or it could be your Internal Promotion Rate. If employees don’t see a progression available in their careers, they tend to go somewhere else.
On the other hand, if morale is fine, are your terminations up? If so, maybe look at Employee Productivity Rate and what you expect from your employees vs. what they’re delivering. If your expectations outweigh results, then you might need to focus on training programs. An HR department with available resources can upskill its workforce, leading to increased employee motivation and a high Employee Retention Rate. Showing your employees that you value them as people and are willing to invest in their future can both drop your Turnover Rate and show new employees that they were hired for a career, not just a job. Additionally, it can drop the company’s recruitment costs significantly, as current employees will be way more likely to refer their colleagues.
This is a great example of why it’s important for an HR department to develop – and execute against – an HR strategy. Increased costs can be bad when they’re recruitment costs, but increased training costs are often a good thing when they lead to a better overall retention rate.
In a future post, we’ll walk through building a set of dashboards that show how this story can play out. Until then, check out the Human Resources Dashboard by Gandes Goldestan. It’s a beautiful snapshot of the changes an HR department sees on a month-over-month basis. Here’s a link.
Conclusion
Key Performance Indicators (KPIs) provide valuable insights into HR processes and enable organizations to make data-driven decisions. By measuring and analyzing these KPIs, HR Analytics Directors can identify areas for improvement, monitor progress towards goals, and drive strategic HR initiatives. Remember, KPIs are like compasses that guide us towards achieving success and creating a positive work environment for all employees.
What’s been your experience? Are there any HR metrics that stand out to you as more important than others? Any that don’t need to be reported on at all? Leave us a comment and let us know!
Happy dashboarding!