35 KPI Marketing Teams Need To Follow in 2023
Introduction
As a marketing analytics director, my role involves using data to drive effective marketing strategy. I use Key Performance Indicators (KPIs) to form that strategy and ensure that the group is always focused on the marketing activities that are good for the company. These powerful metrics enable us to gauge the success of our efforts, optimize campaigns, and ensure our marketing dollars are well-spent. In this article, we will walk through each KPI in the marketing pipeline, how it’s calculated, why it’s important, and how it relates to other KPI. We’ll track from acquiring a customer to growing their account, measuring their overall satisfaction, and the end of the relationship as they churn out. From there, we’ll look at KPIs across different marketing channels and show how they change by channel.
Want to know which KPI marketing managers need to know? Want to see which levers you can pull to move your company forward? Read on!
Group 1: Customer Acquisition and Growth
1. Cost per Lead (CPL)
What is it? Cost per Lead (CPL) is the cost associated with generating a new lead.
Why is it important? CPL helps us assess the effectiveness of our lead generation efforts. We aim for a lower CPL, indicating cost-efficient methods to attract potential customers.
How does it relate to other KPIs? CPL is an integral part of the customer funnel progression, as it affects the Website-Traffic-to-Lead Ratio and Lead-to-MQL Ratio. Efficient lead generation contributes to better funnel progression, ultimately impacting the overall conversion rate.
Equation: CPL = Total Marketing Costs / Number of New Leads
2. Cost per Acquisition (CPA)
What is it? Cost per Acquisition (CPA) quantifies the expense incurred to acquire a new customer.
Why is it important? CPA allows us to measure the efficiency of our customer acquisition strategies. By comparing CPA with the Customer Lifetime Value (CLV), we can determine whether our investments in acquiring new customers are justified in the long run.
How does it relate to other KPIs? CPA is directly related to Customer Lifetime Value (CLV) and Customer Acquisition Cost (CAC). High CPA relative to CLV may indicate inefficient acquisition efforts, while monitoring CAC helps us assess the overall cost-effectiveness of customer acquisition.
Equation: CPA = Total Marketing Costs / Number of New Customers
3. Sales Target & Growth
What is it? Sales Target & Growth compares actual sales performance to predefined targets, revealing growth or underperformance.
Why is it important? Setting realistic sales targets is vital for measuring success and directing marketing efforts. It helps align our team’s focus and drive overall growth.
How does it relate to other KPIs? Sales Target & Growth is interconnected with Conversion Rate and Customer Lifetime Value (CLV). By achieving higher conversion rates and retaining customers, we can meet and exceed sales targets.
Equation: Sales Target & Growth = (Actual Sales – Target Sales) / Target Sales * 100
4. Average Order Value
What is it? Average Order Value computes the average monetary value of each customer transaction.
Why is it important? A higher Average Order Value indicates customers are spending more, resulting in increased revenue and better Return on Advertising Spend (ROAS).
How does it relate to other KPIs? Average Order Value directly influences Customer Lifetime Value (CLV). Higher average order value boosts CLV, making it more cost-effective to acquire and retain customers.
Equation: Average Order Value = Total Revenue / Number of Orders
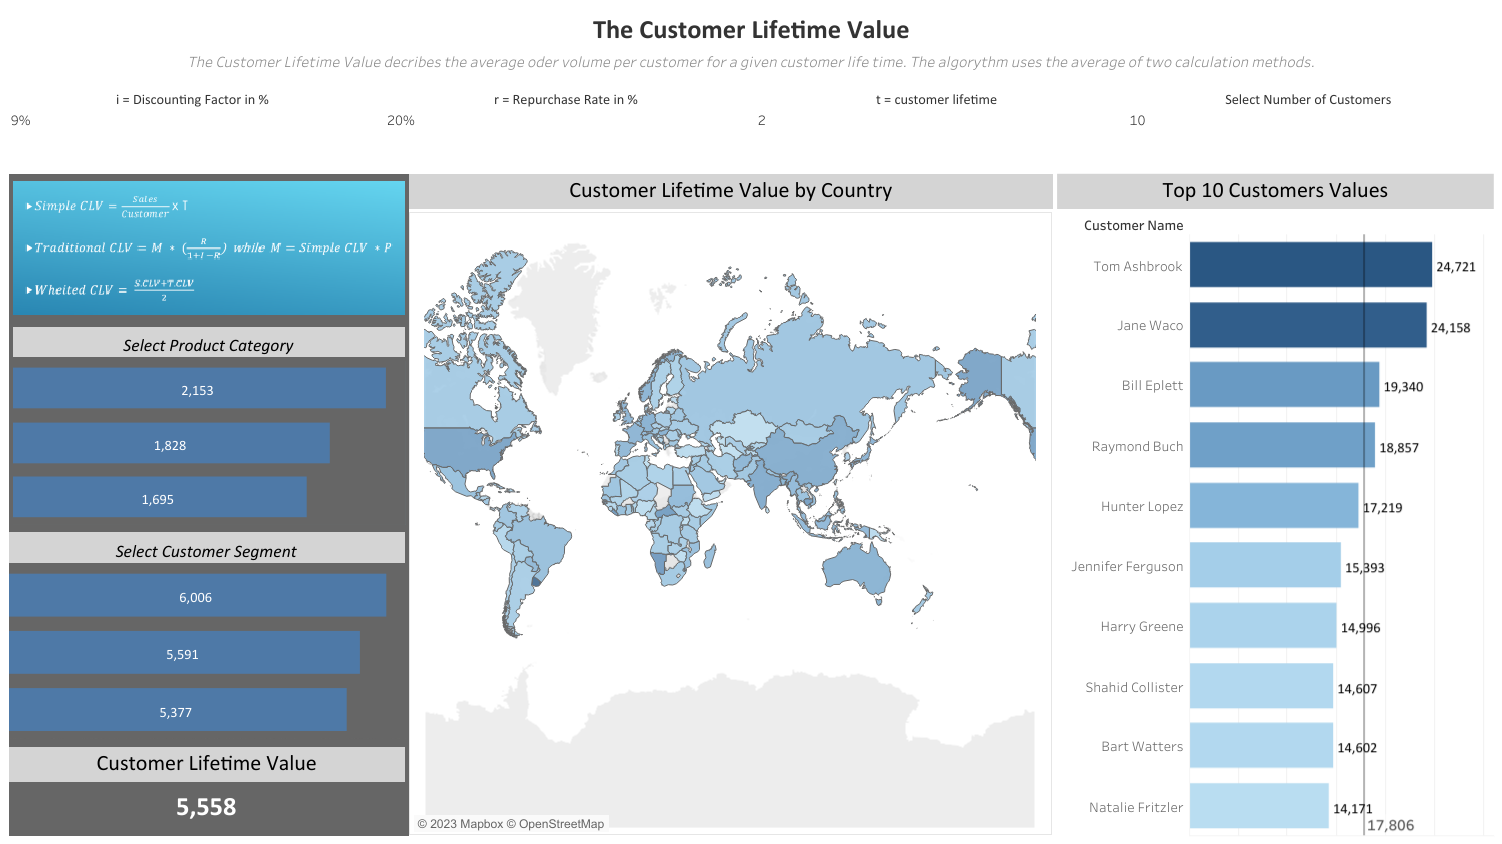
5. Customer Lifetime Value (CLV or CLTV)
What is it? Customer Lifetime Value (CLV) determines the net profit a customer contributes to the business over their lifetime.
Why is it important? CLV helps us prioritize valuable customers and allocate resources wisely. It guides our marketing decisions, focusing on activities that maximize customer retention and loyalty.
How does it relate to other KPIs? CLV is closely related to Customer Acquisition Cost (CAC) and Customer Retention Rate. The lower the CAC and higher the retention rate, the greater the CLV, indicating more profitable customer relationships.
Equation: CLV = Average Order Value * Average Purchase Frequency * Customer Lifespan
Example: This dashboard by Andre Goehler lets you model CLV with different factors:
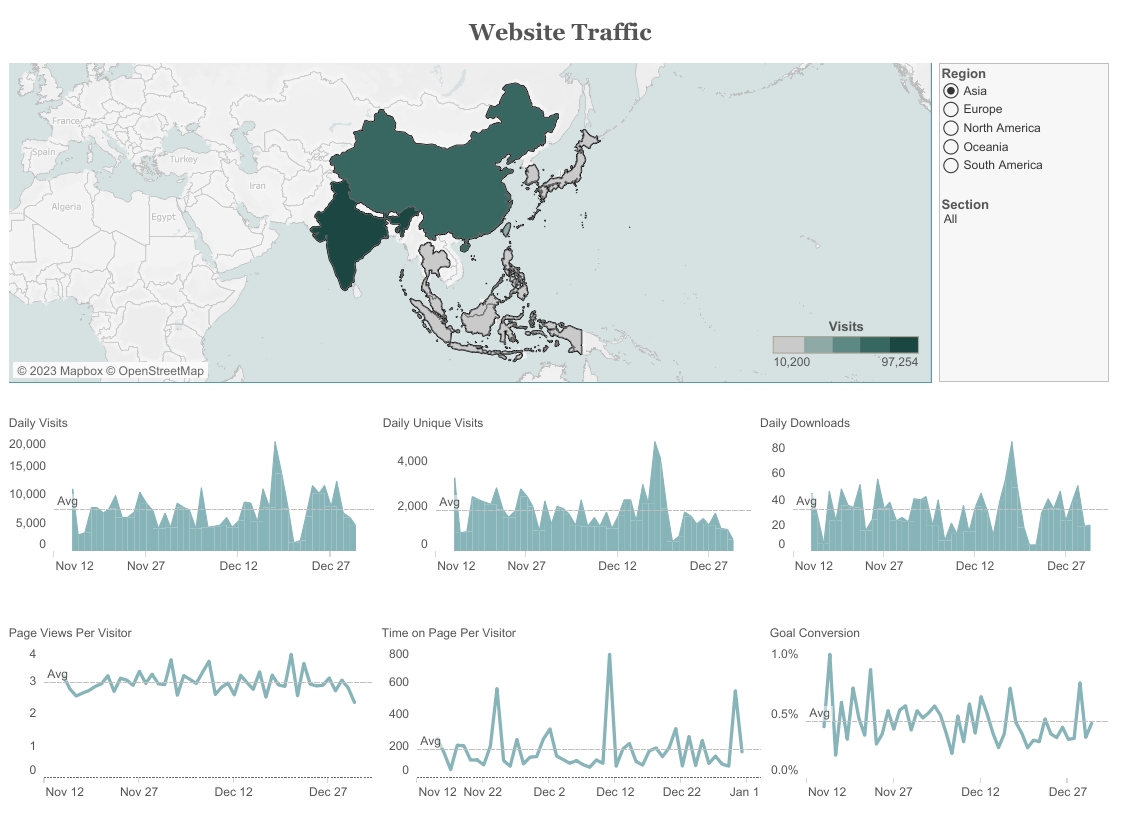
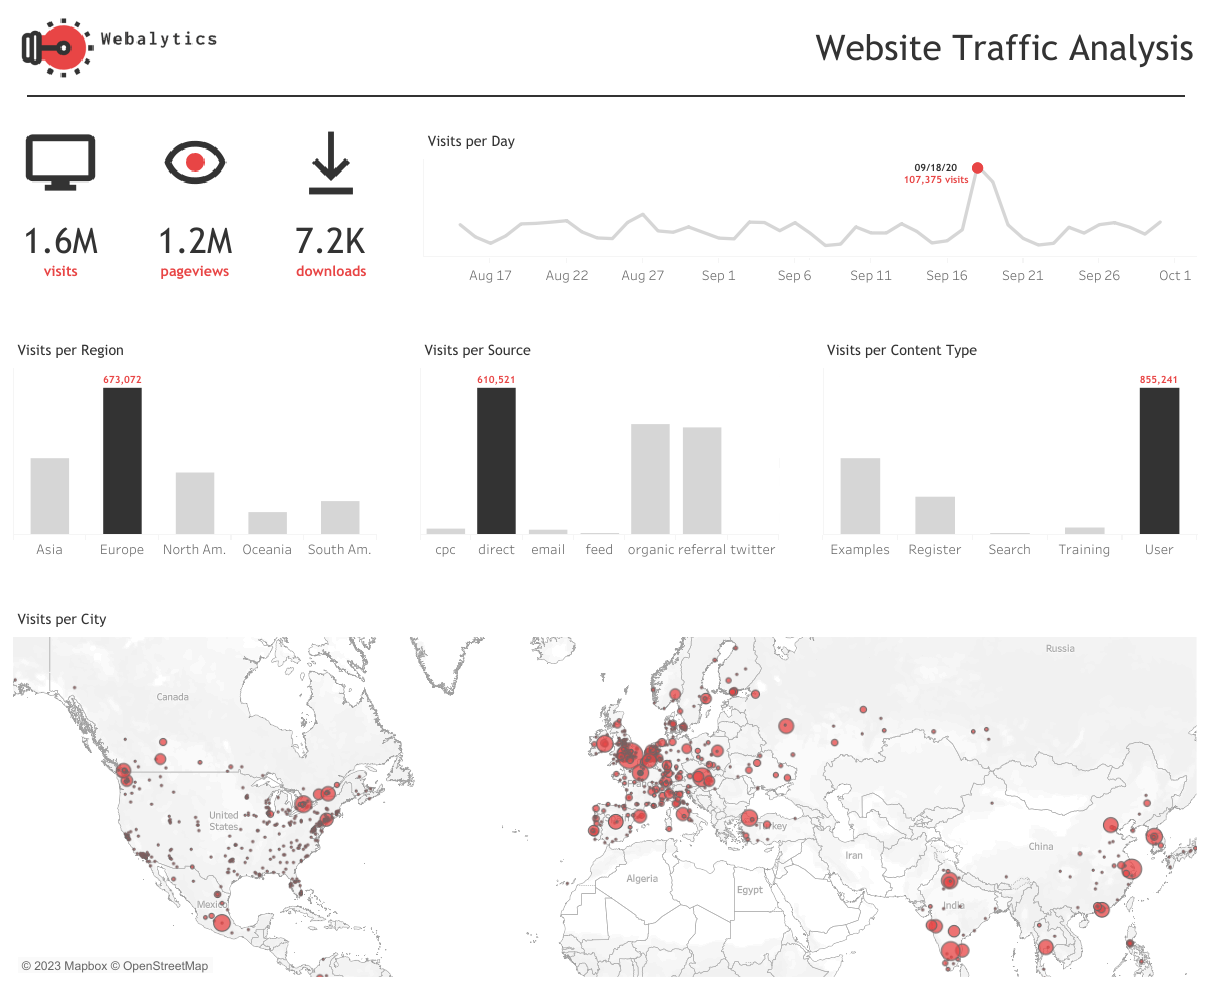
6. Website Traffic
What is it? Website Traffic represents the total number of visitors coming to our website.
Why is it important? Monitoring Website Traffic helps us gauge overall brand visibility and the effectiveness of marketing campaigns.
How does it relate to other KPIs? Website Traffic affects Goal Conversion Rate and Cost per Click (CPC). Higher website traffic can lead to increased conversions and potentially lower CPC in advertising.
Equation: Website Traffic = Total Website Visitors
Example: This dashboard was created by Core Product Marketing from Tableau:
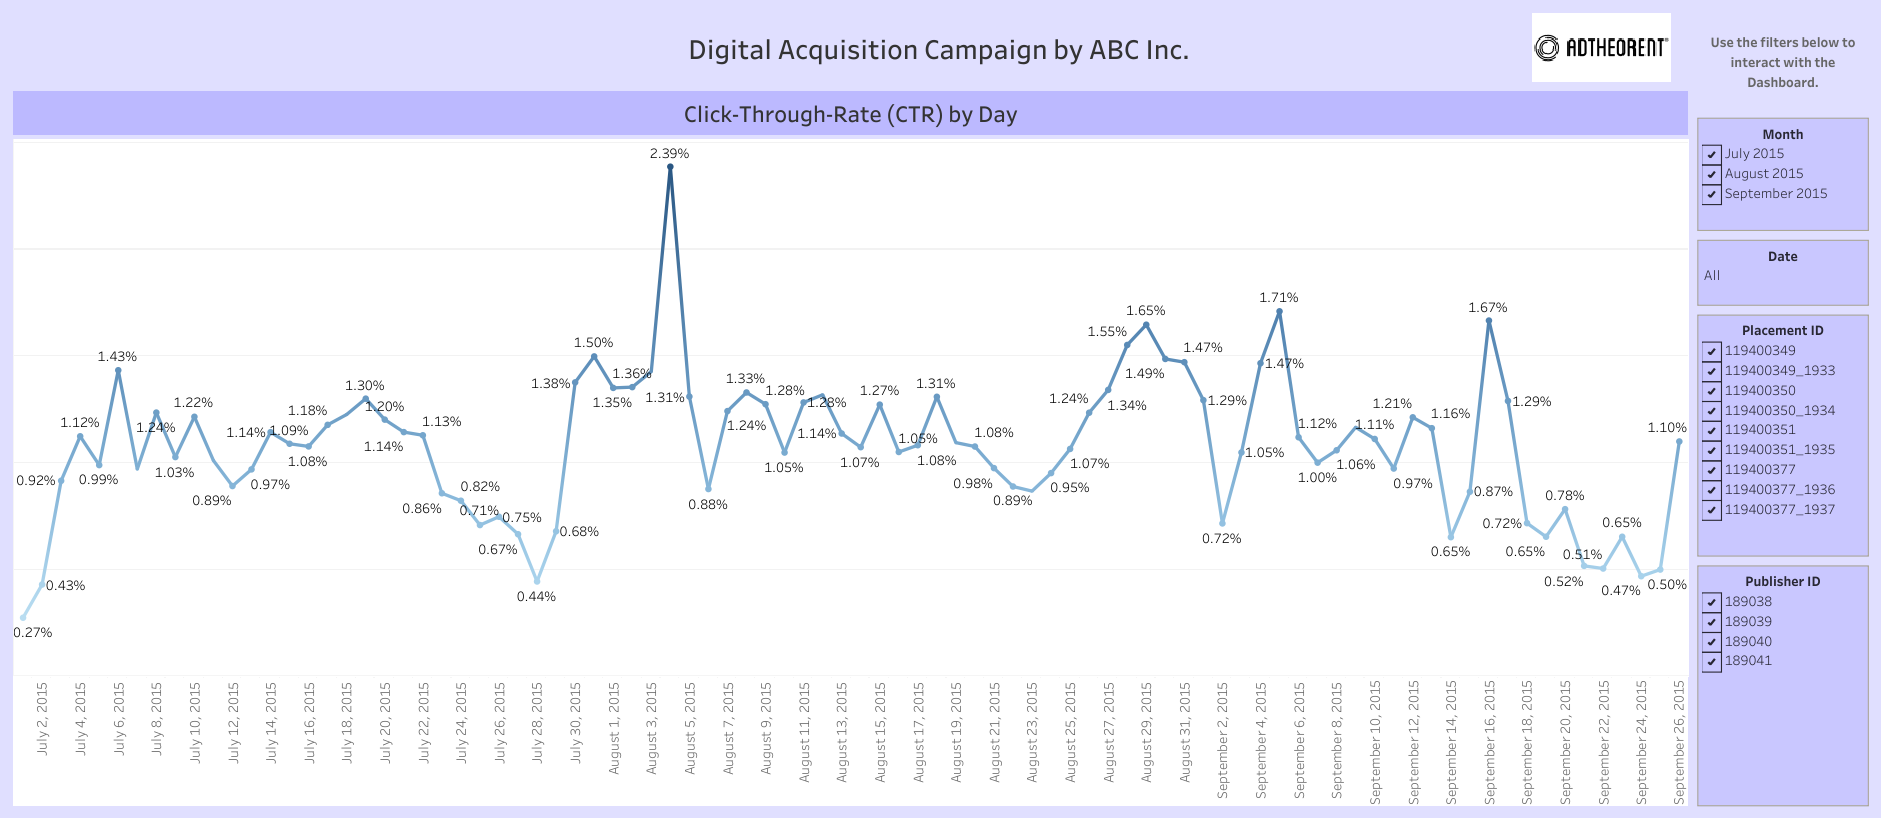
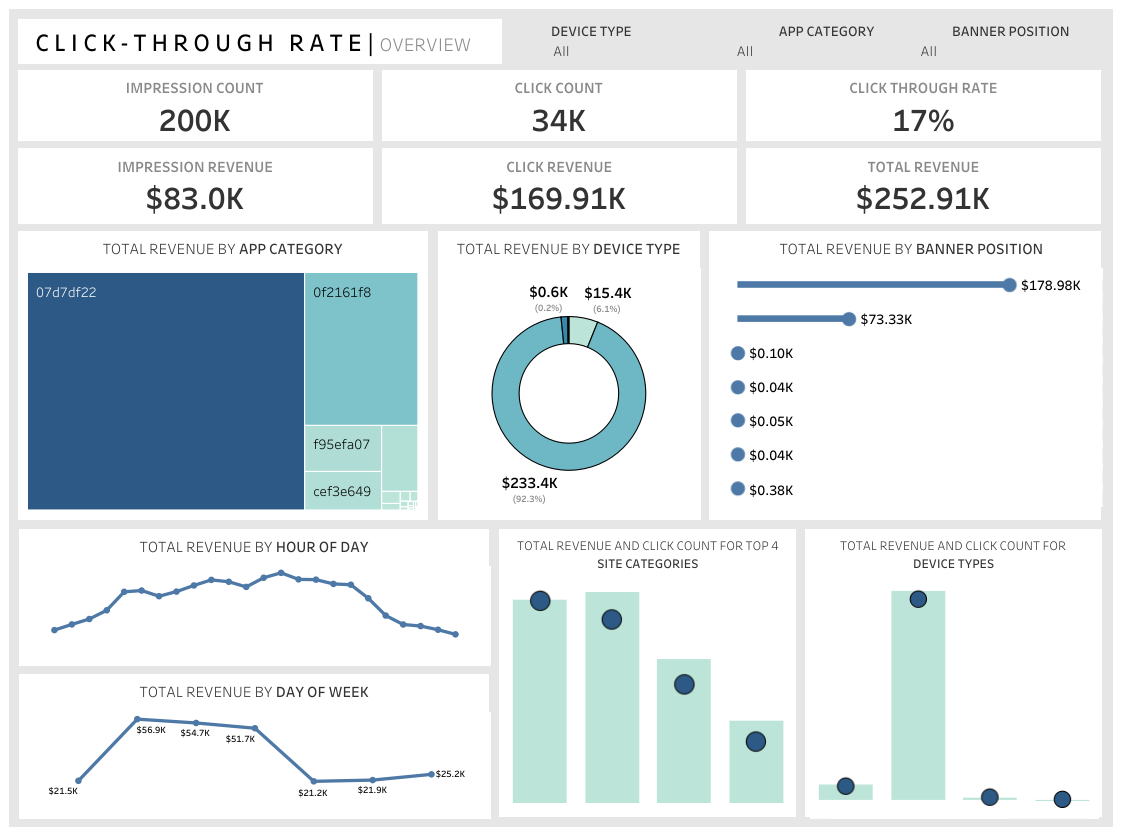
7. Click-Through Rate (CTR)
What is it? CTR calculates the percentage of people who click on a specific link or ad after viewing it.
Why is it important? A higher CTR suggests effective ad messaging and attracts more potential customers.
How does it relate to other KPIs? CTR is related to Cost per Click (CPC) and Return on Advertising Spend (ROAS). Higher CTR can lead to lower CPC and better ROAS.
Equation: CTR = (Total Clicks / Total Impressions) * 100
Example: Dushyant Kumar shows CTR trends in the dashboard below:
8. Customer Acquisition Cost (CAC)
What is it? Customer Acquisition Cost (CAC) measures the average cost of acquiring a new customer.
Why is it important? CAC helps us optimize customer acquisition efforts and allocate resources wisely.
How does it relate to other KPIs? CAC is linked to Customer Lifetime Value (CLV) and Return on Advertising Spend (ROAS). A lower CAC relative to CLV indicates cost-effective acquisition, while a positive ROAS justifies the acquisition cost.
Equation: CAC = Total Marketing Costs / Number of New Customers
9. Return on Advertising Spend (ROAS)
What is it? ROAS reveals the revenue generated for every dollar spent on advertising.
Why is it important? A higher ROAS indicates profitable advertising campaigns with significant returns.
How does it relate to other KPIs? ROAS is directly related to Customer Acquisition Cost (CAC). A positive ROAS justifies the cost incurred in acquiring customers.
Equation: ROAS = Revenue from Advertising / Total Ad Spend
10. Marketing Qualified Leads (MQLs)
What is it? Marketing Qualified Leads (MQLs) are potential customers showing substantial interest in our products or services.
Why is it important? MQLs are crucial for effective lead nurturing and effective collaboration between marketing and sales teams.
How does it relate to other KPIs? MQLs influence Lead-to-MQL Ratio and MQL-to-SQL Ratio. Effective lead nurturing impacts the progression of leads through the funnel.
No specific equation, as MQLs are identified through lead scoring and predetermined criteria.
11. Lead-to-MQL Ratio
What is it? Lead-to-MQL Ratio compares the number of leads generated to the number of Marketing Qualified Leads (MQLs). A marketing qualified lead is someone who has responded to marketing materials and is close to making a purchase. They can then be passed to the sales organization to close the sale.
Why is it important? A higher ratio indicates effective lead nurturing, helping the sales team identify potential customers more efficiently.
How does it relate to other KPIs? Lead-to-MQL Ratio influences the MQL-to-SQL Ratio and the overall conversion rate. Efficient lead nurturing improves the quality of leads passed to the sales team, increasing the chances of conversion.
Equation: Lead-to-MQL Ratio = (Number of MQLs / Total Leads) * 100
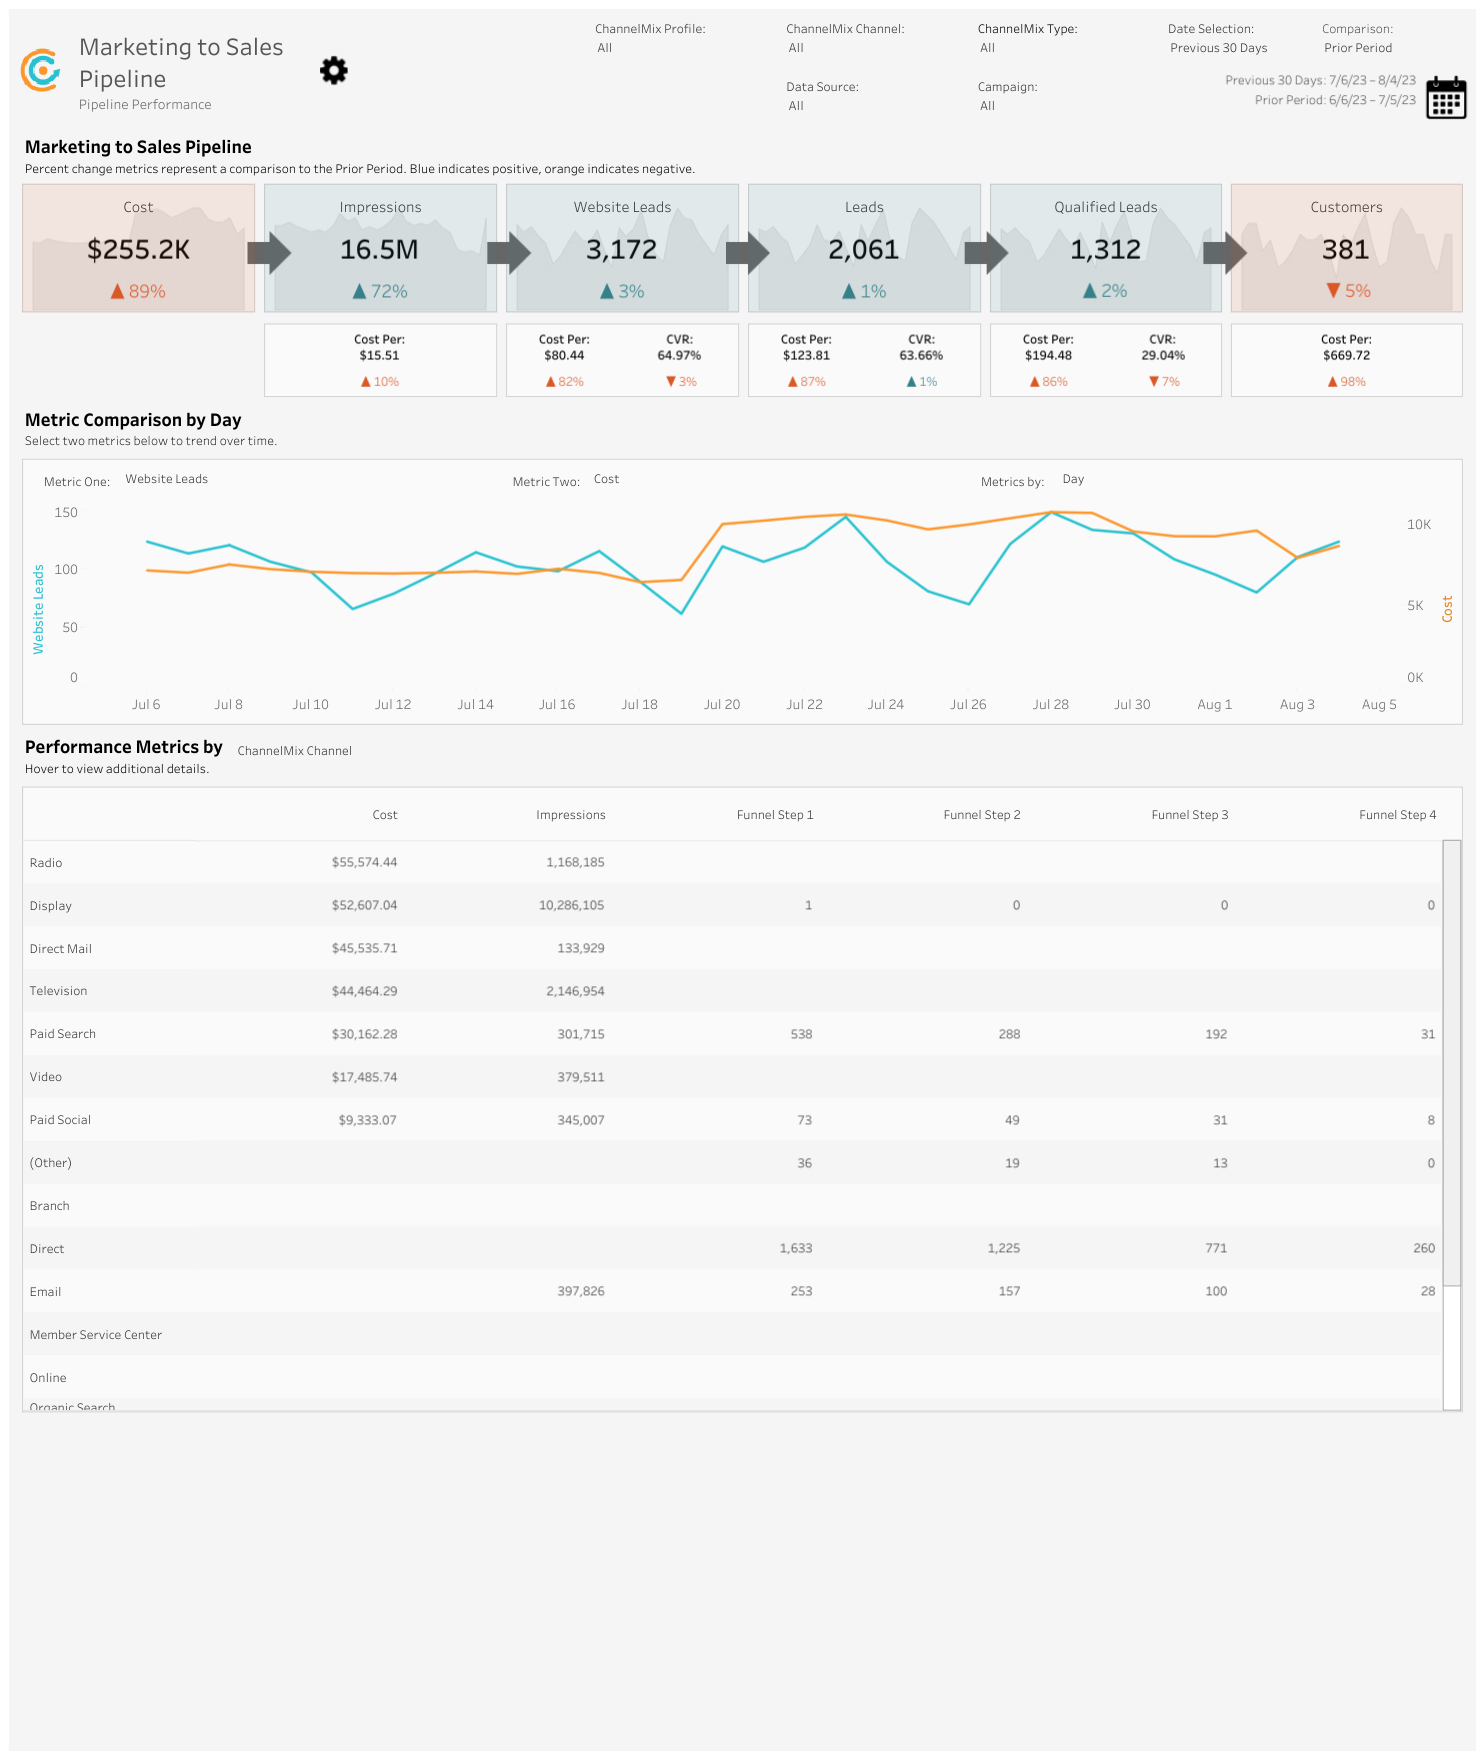
12. MQL-to-SQL Ratio
What is it? MQL-to-SQL Ratio is the percentage of Marketing Qualified Leads (MQLs) that turn into Sales Qualified Leads (SQLs). A sales qualified lead has made it to the stage in the buying process where they’re highly likely to become a customer.
Why is it important? A higher ratio indicates better alignment between marketing and sales teams, resulting in more qualified leads for the sales team to pursue.
How does it relate to other KPIs? MQL-to-SQL Ratio is related to the overall conversion rate. Efficient lead qualification increases the likelihood of converting leads into customers.
Equation: MQL-to-SQL Ratio = (Number of SQLs / Total MQLs) * 100
Example: This dashboard by ChannelMix shows the full pipeline beautifully:
13. Product Adoption Rate
What is it? A measure showing the number of current customers that actually use a product (or a feature of a product) divided by all current customers.
Why is it important? It better predicts the lifespan (and thus the lifetime value) of a customer. If a customer buys your product but never even installs it, they’ll churn much faster than one who adopts it company-wide.
How does it relate to other KPIs? It’s directly related to CLTV. The higher the adoption rate, the higher the customer lifetime value. Think of it this way: are you more likely to buy an iPhone if you a) only own a Samsung phone or b) have a Samsung phone, watch, tablet, and smart TV?
Equation: Adoption Rate = Count of Existing Customers Using Product / Total Count of Existing Customers
Group 2: Customer Retention
14. Customer Referral Rate
What is it? The number of purchases by referred customers divided by the total number of purchases. It shows the percentage of your revenue (some track by the total number of customers, so you may see it that way) that comes by way of referral.
Why is it important? It’s an excellent measure for growth. People are substantially more likely to buy when a trusted source makes a recommendation than they are by normal sales tactics alone. Don’t fall into the trap of thinking this is free marketing, however. It can be, but referrals are often sales pipelines of their own and can involve marketing investment to keep your product top-of-mind for the referrer.
How does it relate to other KPIs?
Equation: We’ll give two variations here:
- Revenue (more common): Sum of Sales by Referred Customers / Total Sales
- Count of Customers (less common): Count of Referred Customers / Count of All Customers
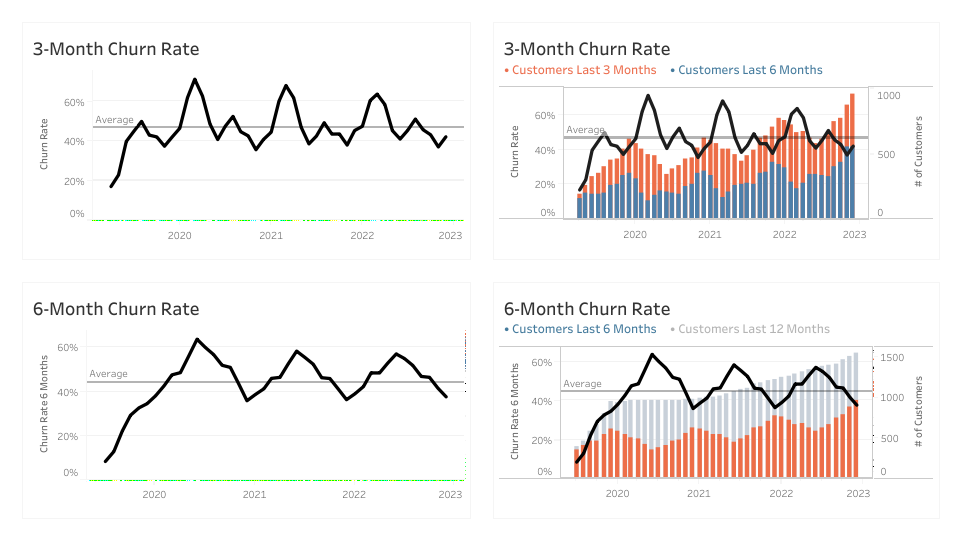
15. Churn Rate
What is it? Churn Rate tracks the percentage of customers who stop using our product or service within a specific period. It’s also the inverse of Customer Retention Rate. If 10% of your customers churn in a certain period, your Customer Retention Rate is 90$.
Why is it important? A lower Churn Rate signifies better customer retention efforts.
How does it relate to other KPIs? Churn Rate is inversely related to Customer Retention Rate and Customer Lifetime Value (CLV). A lower Churn Rate contributes to higher CLV and more retained customers.
Equation: Churn Rate = (Number of Churned Customers / Total Customers at the Start) * 100
Example: As with anything dashboarding, you can’t do better than Andy Kriebel. Here’s his version explaining Churn Rate:
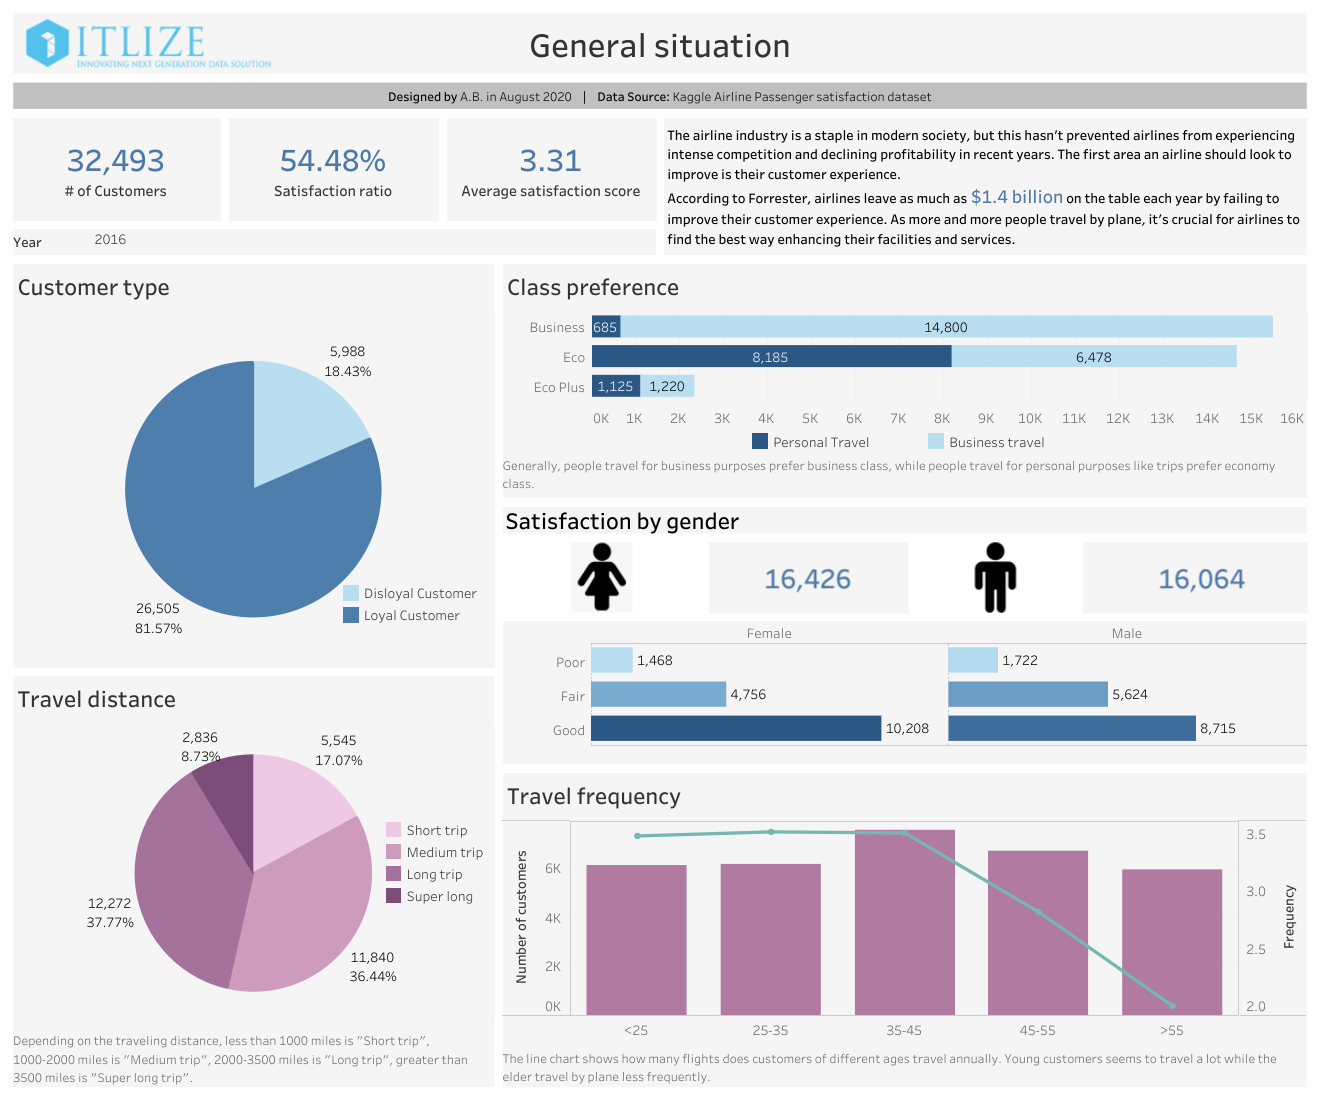
16. Customer Satisfaction
What is it? Customer Satisfaction measures how content customers are with our products or services.
Why is it important? Customer Satisfaction helps us identify areas for improvement and foster long-term loyalty.
How does it relate to other KPIs? Customer Satisfaction impacts Customer Retention Rate and Net Promoter Score (NPS). Higher customer satisfaction leads to greater retention and higher NPS.
Equation: Customer Satisfaction = (Number of Satisfied Customers / Total Survey Respondents) * 100
Example: This dashboard, by Itlize Global, breaks down Customer Satisfaction:
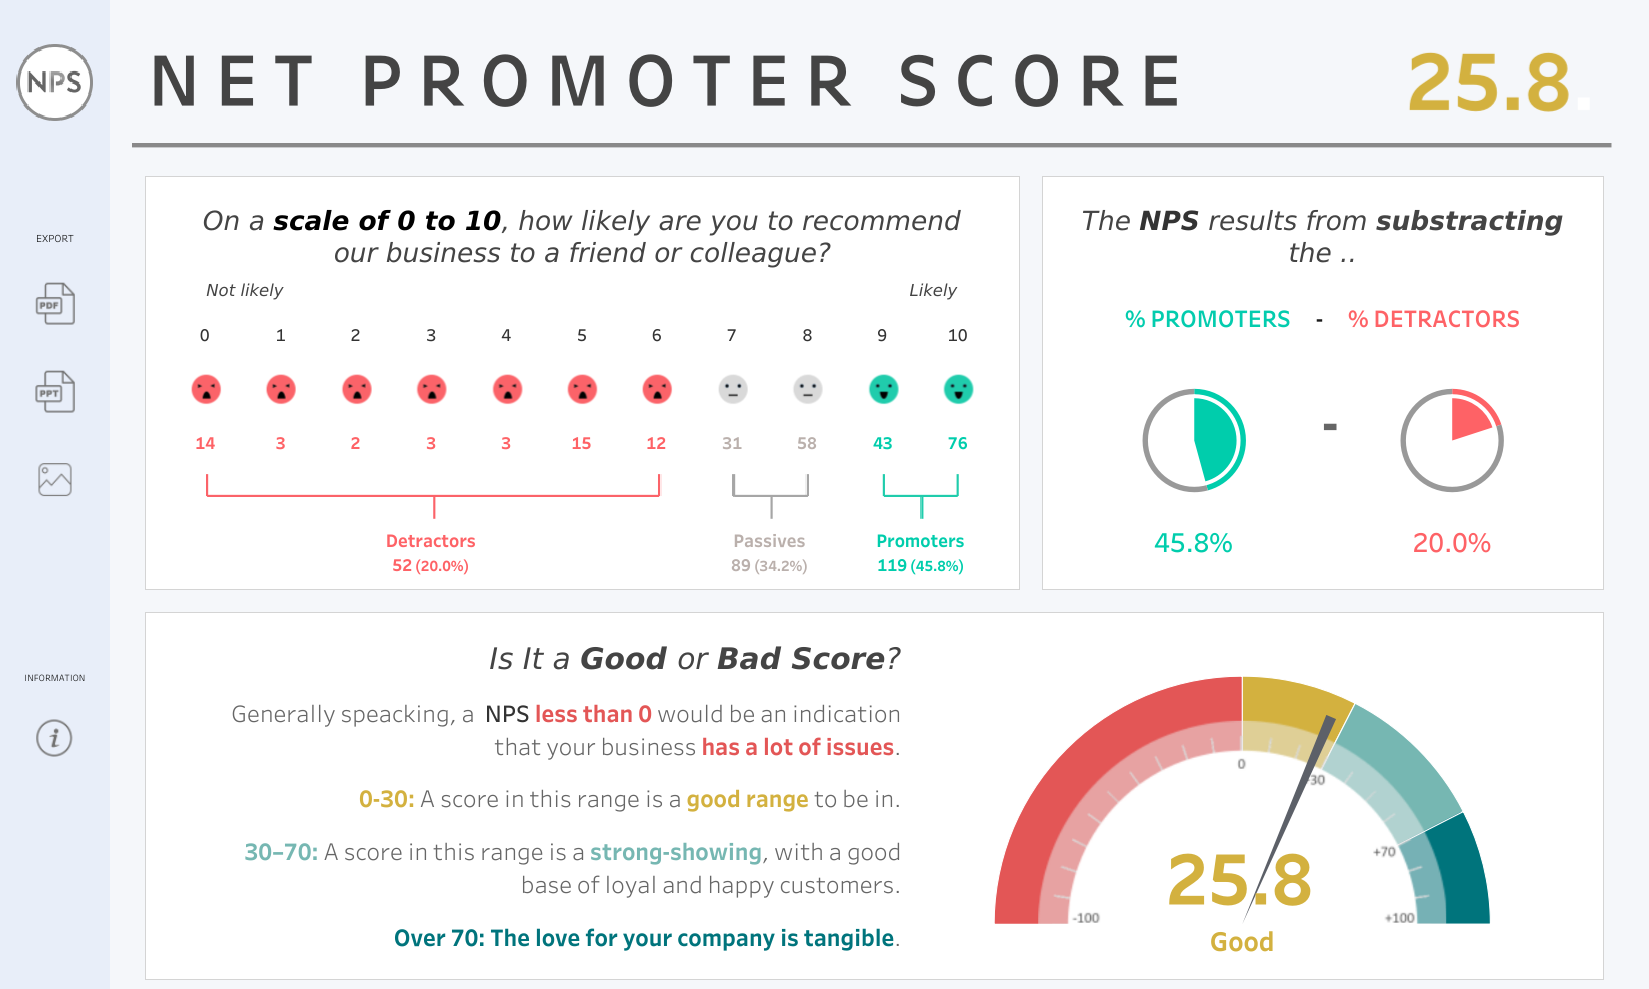
17. Net Promoter Score (NPS)
What is it? NPS helps measure customer loyalty and satisfaction by asking how likely they are to recommend our brand to others.
Why is it important? A higher NPS indicates satisfied customers who can become brand advocates.
How does it relate to other KPIs? NPS is related to Customer Satisfaction and Social Media Engagement Rate. Satisfied customers are more likely to engage positively on social media and promote the brand.
Equation: NPS = % Promoters – % Detractors
Example: This dashboard was created by Rosario Guana, and it’s nearly perfect:
Group 3: Marketing Channels – Online
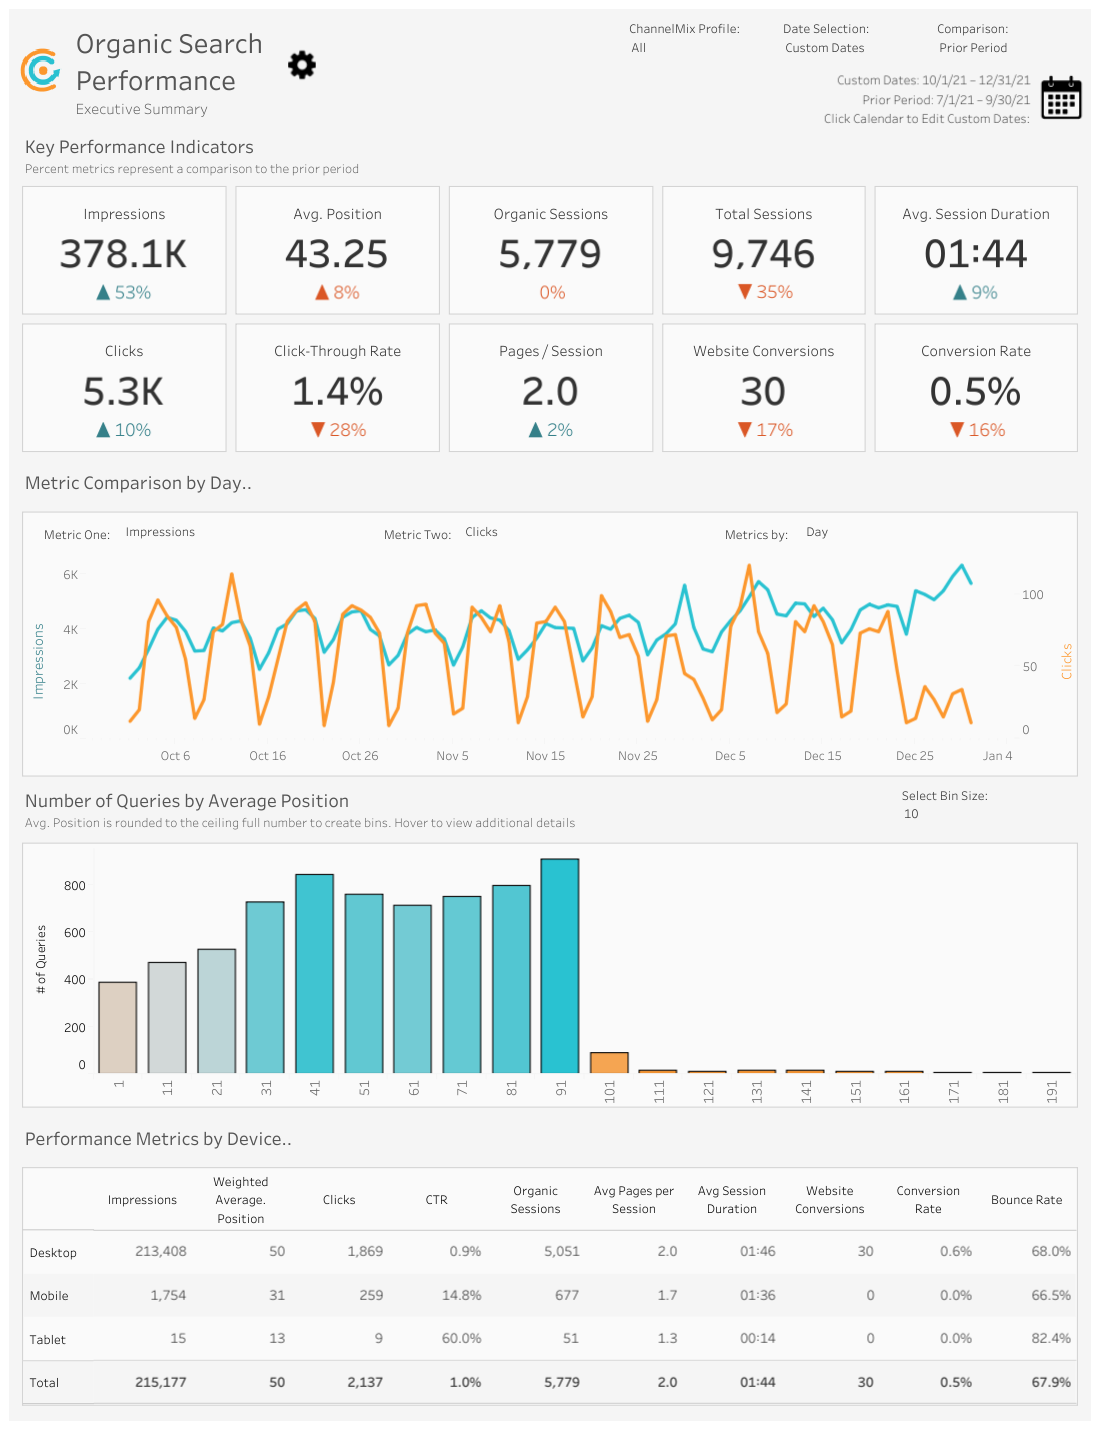
18. Organic Search Traffic
What is it? Organic Search Traffic tracks the number of visitors who find our website through unpaid search engine results.
Why is it important? Monitoring Organic Search Traffic showcases our online visibility and content relevance.
How does it relate to other KPIs? Organic Search Traffic affects Conversion Rate and Cost per Click (CPC). Higher organic traffic leads to increased conversions and potentially lower CPC.
Equation: Organic Search Traffic = Total Organic Visits
Example: This dashboard, by ChannelMix, does a great job of breaking down Organic Search:
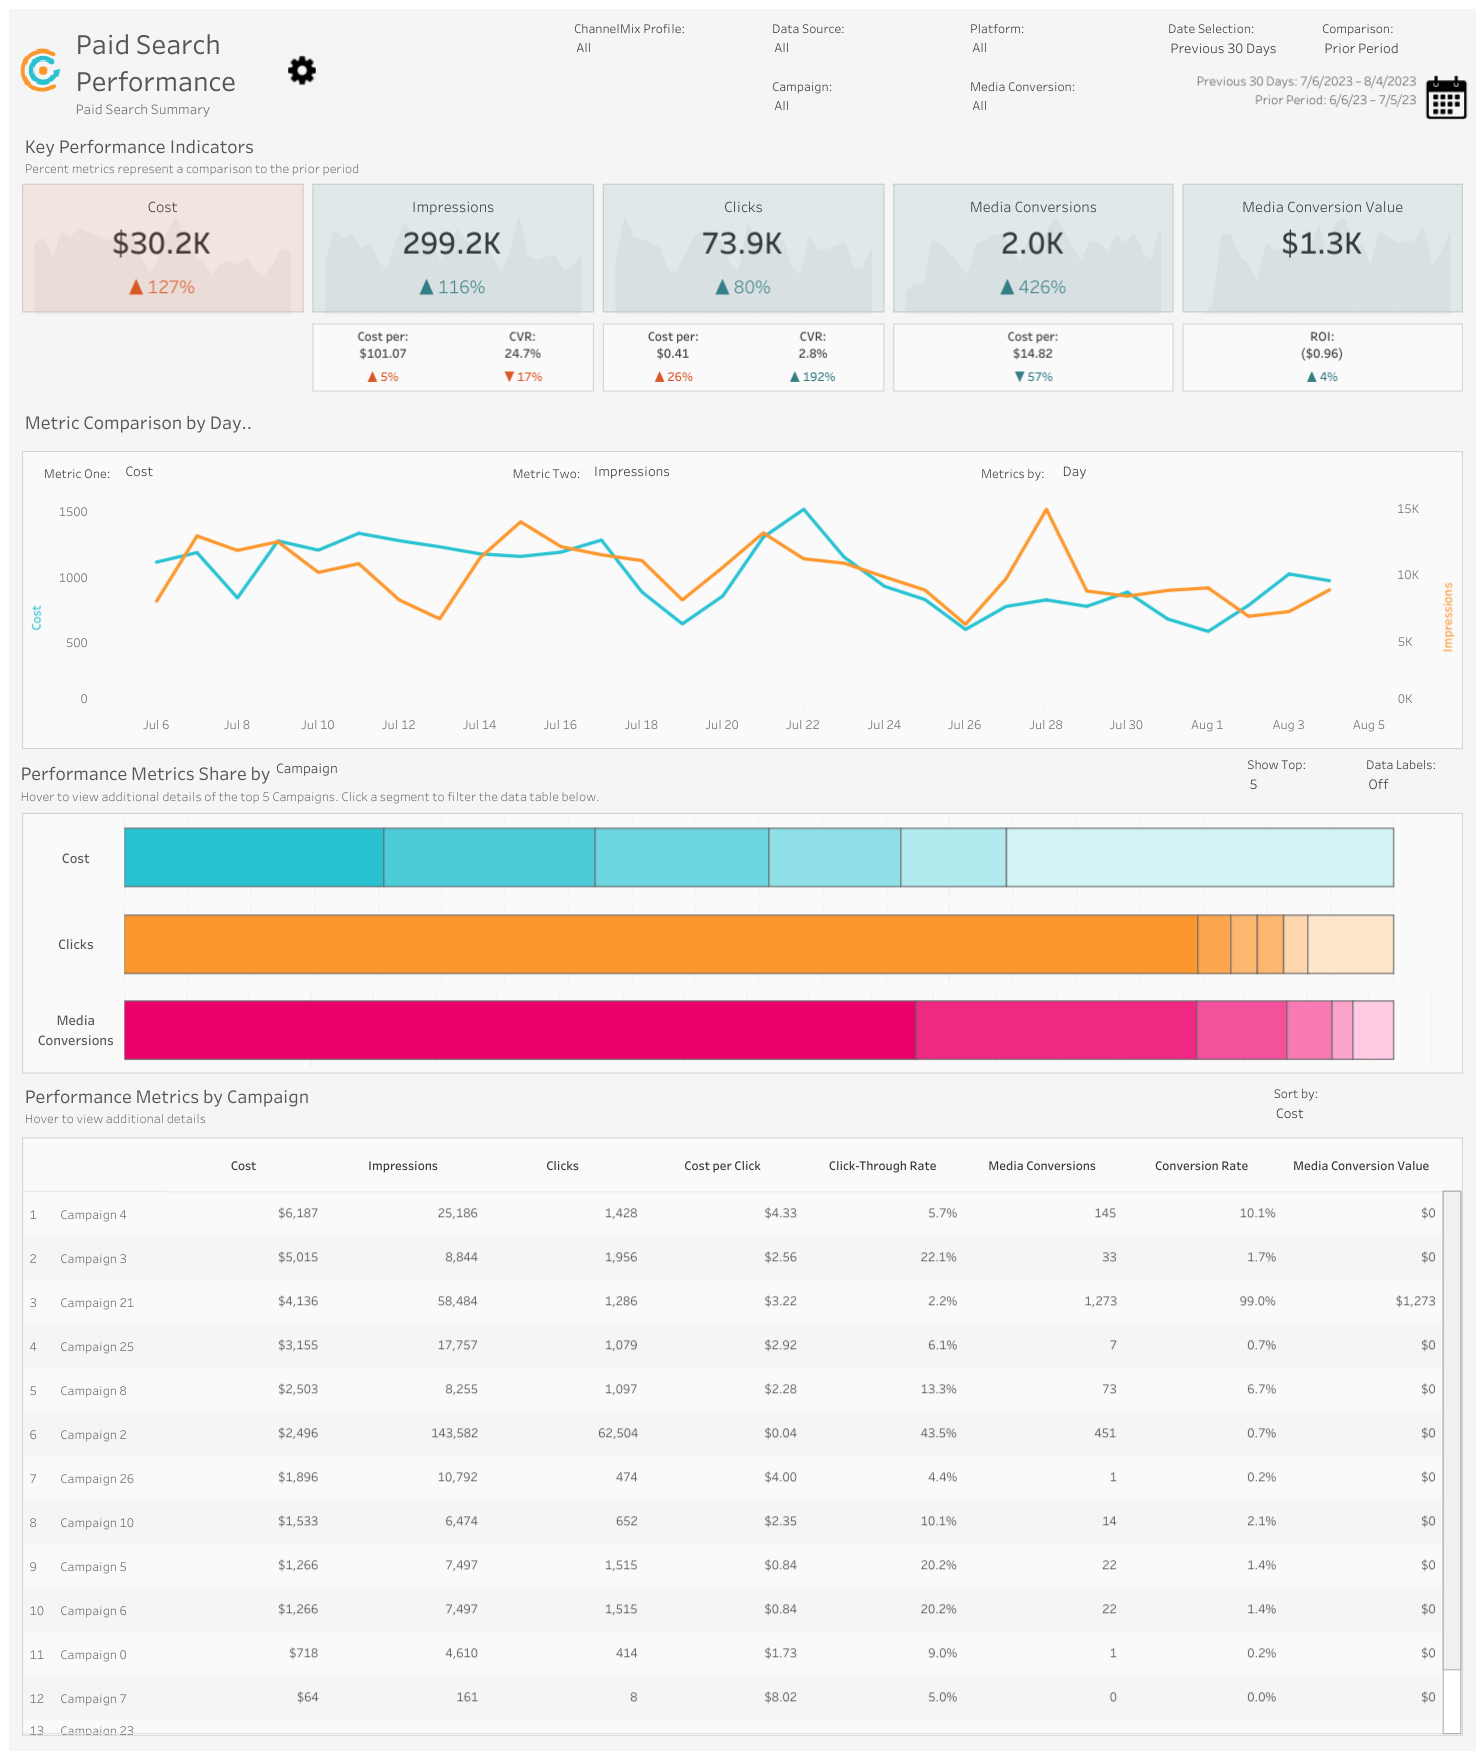
19. Paid Search Traffic
What is it? Paid Search Traffic measures the number of visitors who find our website through paid search campaigns.
Why is it important? Monitoring Paid Search Traffic highlights the effectiveness of our paid advertising efforts.
How does it relate to other KPIs? Paid Search Traffic is linked to Conversion Rate and Cost per Click (CPC). Effective paid campaigns can lead to higher conversion rates and potentially lower CPC.
Equation: Paid Search Traffic = Total Paid Search Visits
Example: ChannelMix also has a very elegant Paid Search view here:
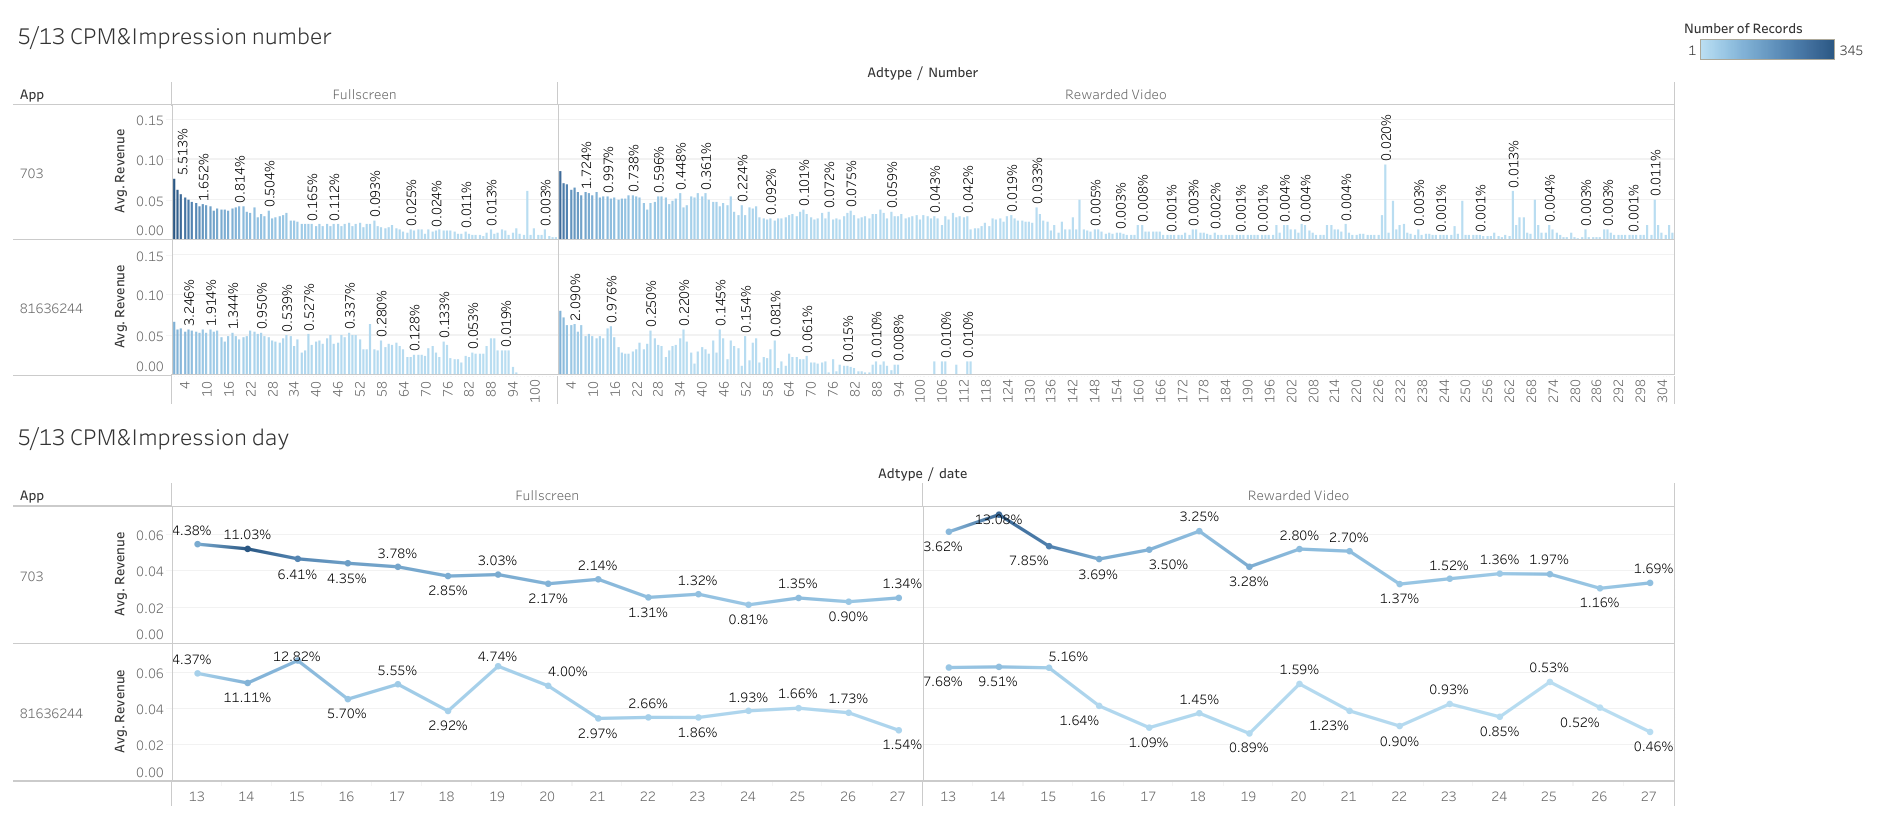
20. Cost Per Mille (CPM)
What is it? CPM calculates the cost per thousand impressions for a specific ad or campaign.
Why is it important? Monitoring CPM helps us optimize ad spending and reach.
How does it relate to other KPIs? CPM is related to Cost per Click (CPC) and Return on Advertising Spend (ROAS). Lower CPM can lead to lower CPC and better ROAS.
Equation: CPM = (Total Ad Spend / Total Impressions) * 1000
Example: Charlie8475 built an interesting CPM view, shown below:
21. Cost per Click (CPC)
What is it? Cost per Click (CPC) calculates the average cost incurred for each click on our ads.
Why is it important? Monitoring CPC helps us optimize ad spending and allocate budgets more effectively.
How does it relate to other KPIs? CPC is closely related to Cost per Acquisition (CPA) and Return on Advertising Spend (ROAS). Lower CPC contributes to a more cost-effective CPA and better ROAS.
Equation: CPC = Total Ad Spend / Total Clicks
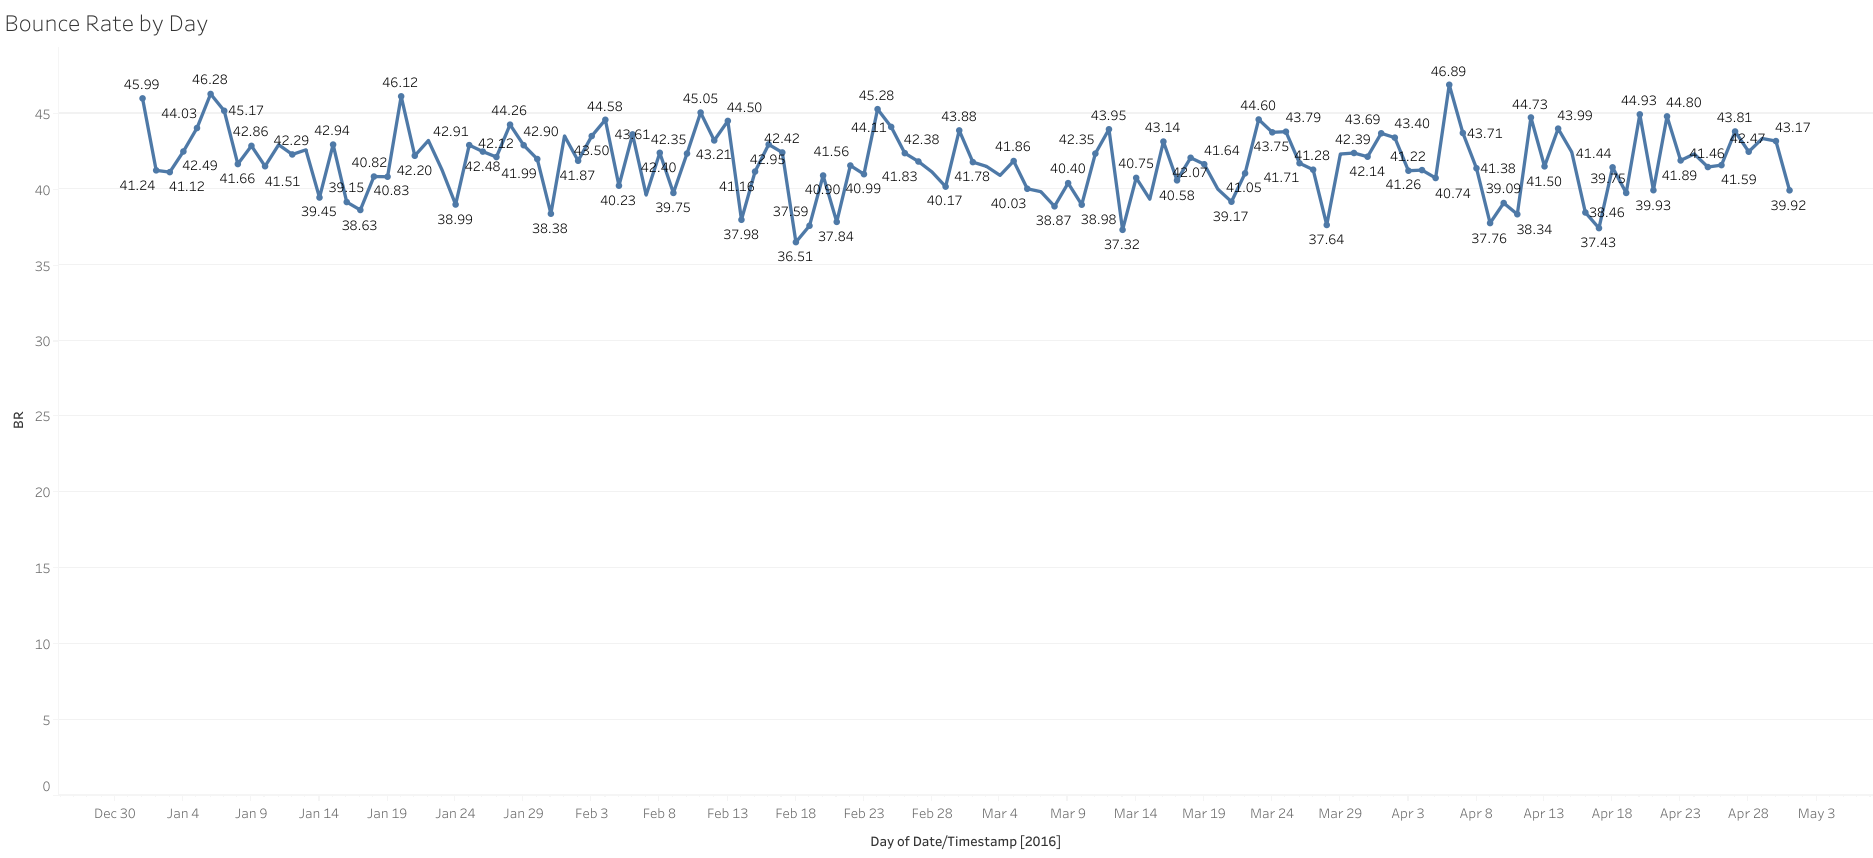
22. Bounce Rate
What is it? Bounce Rate measures the percentage of visitors who leave a webpage without interacting further.
Why is it important? Monitoring Bounce Rate helps us identify poorly performing pages and improve user experience to retain visitors.
How does it relate to other KPIs? Bounce Rate affects Website-Traffic-to-Lead Ratio and Conversion Rate. A high bounce rate may lead to lower conversion rates and hinder funnel progression.
Equation: Bounce Rate = (Number of Single-page Sessions / Total Sessions) * 100
Example: This dashboard by Sandesh Keshavan shows Bounce Rates over time:
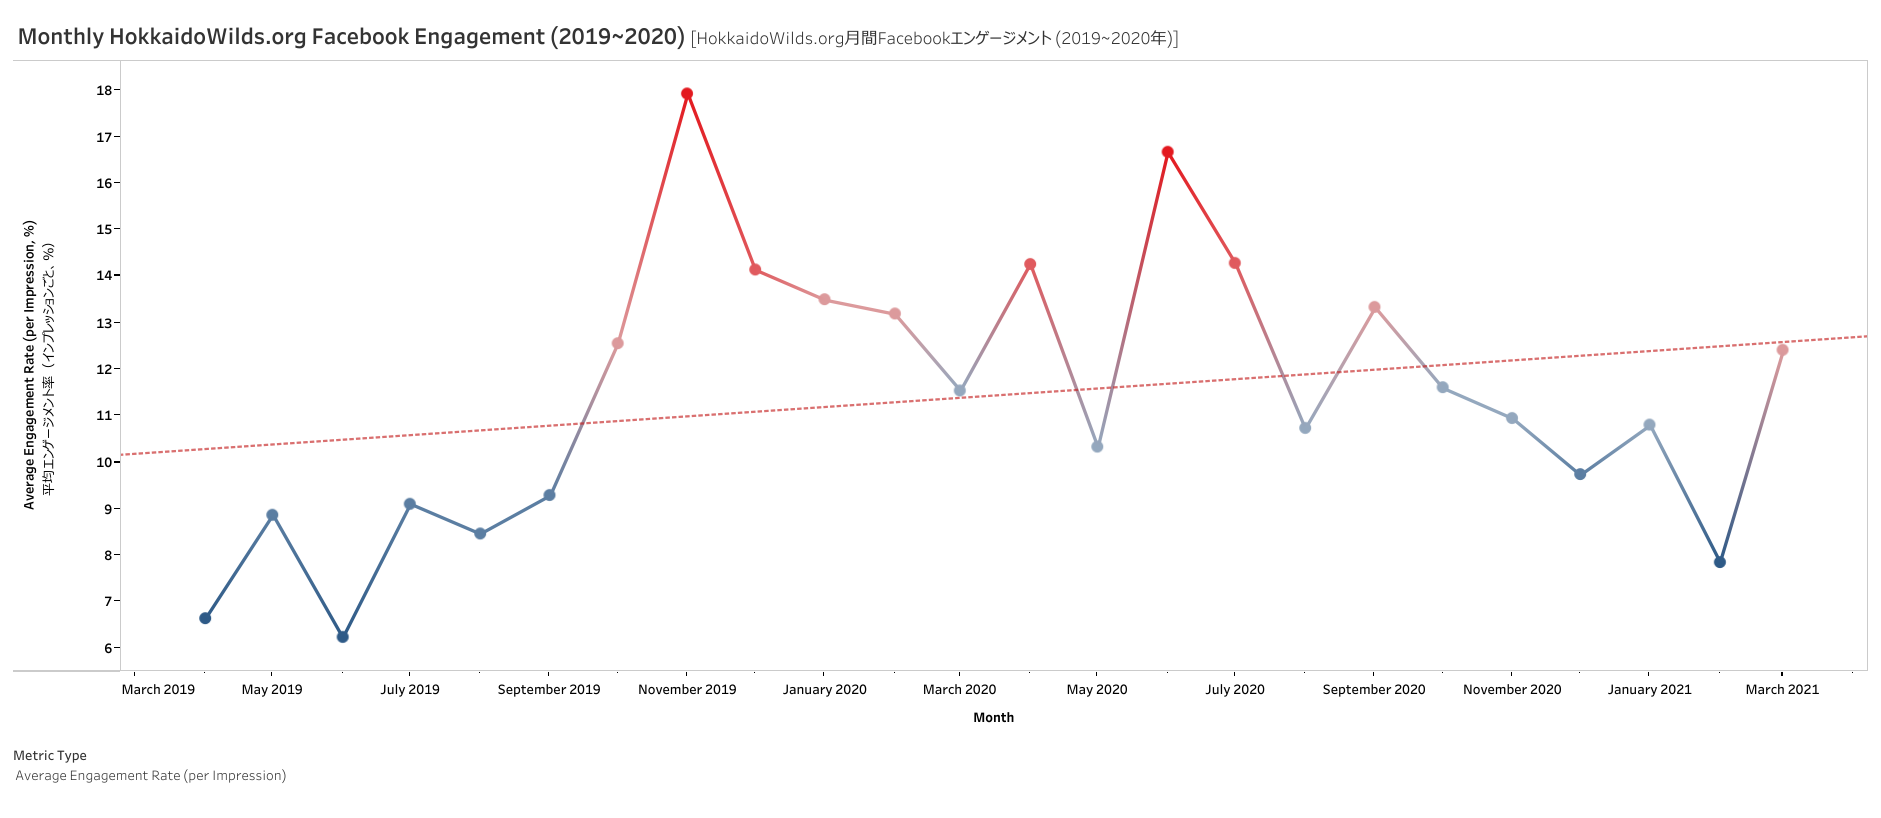
23. Engagement Rate
What is it? Engagement Rate measures the level of interaction with our content, including likes, comments, and shares.
Why is it important? A higher Engagement Rate suggests successful content that resonates with the audience.
How does it relate to other KPIs? Engagement Rate is related to Social Media Follower Growth Rate and Customer Satisfaction. Higher engagement drives more followers and satisfied customers.
Equation: Engagement Rate = (Total Engagements / Total Reach) * 100
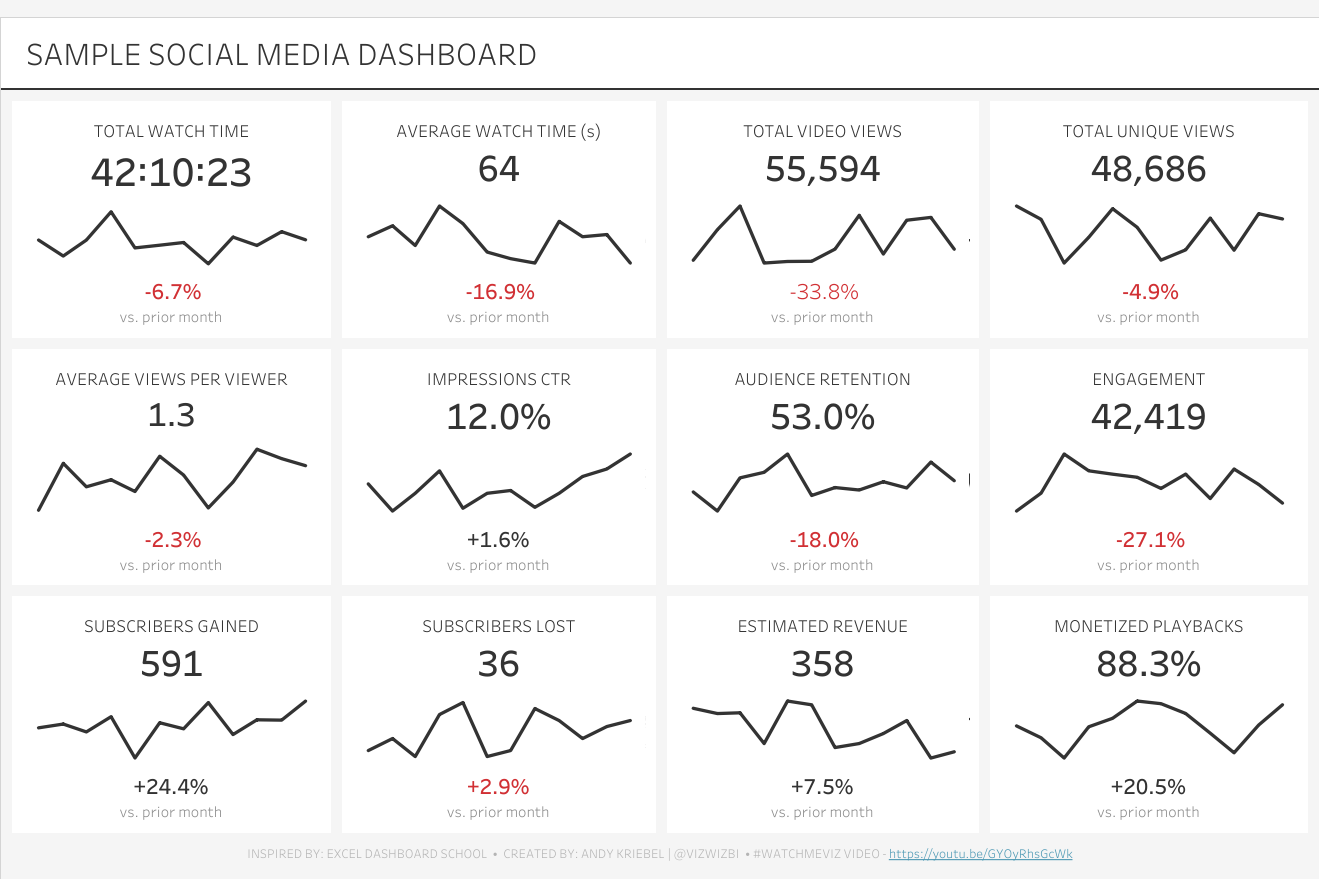
Example: This dashboard by Robert Thomson shows engagement trends by month and year:
24. Time on Page
What is it? Time on Page measures how long visitors spend on specific web pages.
Why is it important? Longer time on page indicates engaging content and better user experience.
How does it relate to other KPIs? Time on Page influences Bounce Rate and Goal Conversion Rate. Engaging content reduces bounce rates and drives conversions.
Equation: Time on Page = Total Time Spent on Page / Total Pageviews
25. Average Time to Conversion
What is it? Average Time to Conversion measures the average time taken from lead generation to the final conversion.
Why is it important? Monitoring the time to conversion helps us identify bottlenecks and improve the customer journey, leading to quicker conversions.
How does it relate to other KPIs? Average Time to Conversion influences Goal Conversion Rate and the overall conversion rate. Shorter time to conversion enhances customer satisfaction and drives conversion rates.
Equation: Average Time to Conversion = Total Time Taken for Conversions / Number of Conversions
26. Landing Page Conversion Rate
What is it? Landing Page Conversion Rate measures how well specific landing pages convert visitors into leads or customers.
Why is it important? A higher Landing Page Conversion Rate indicates effective landing page design and persuasive content that encourages action.
How does it relate to other KPIs? Landing Page Conversion Rate is linked to Goal Conversion Rate and Website-Traffic-to-Lead Ratio. Well-optimized landing pages contribute to higher goal conversion rates and more efficient funnel progression.
Equation: Landing Page Conversion Rate = (Number of Conversions / Total Landing Page Visitors) * 100
27. Website Traffic-to-Lead Ratio
What is it? Website Traffic-to-Lead Ratio measures the percentage of website visitors that convert into leads.
Why is it important? A high ratio signifies an efficient website that engages visitors and converts them into potential customers.
How does it relate to other KPIs? Website Traffic-to-Lead Ratio is linked to Lead-to-MQL Ratio and MQL-to-SQL Ratio. A well-optimized website drives more leads, ultimately influencing the overall conversion rate.
Equation: Website-Traffic-to-Lead Ratio = (Number of Leads / Total Website Visitors) * 100
Example: Allison Wright expertly breaks down website traffic here:
Group 3: Marketing Channels – Email
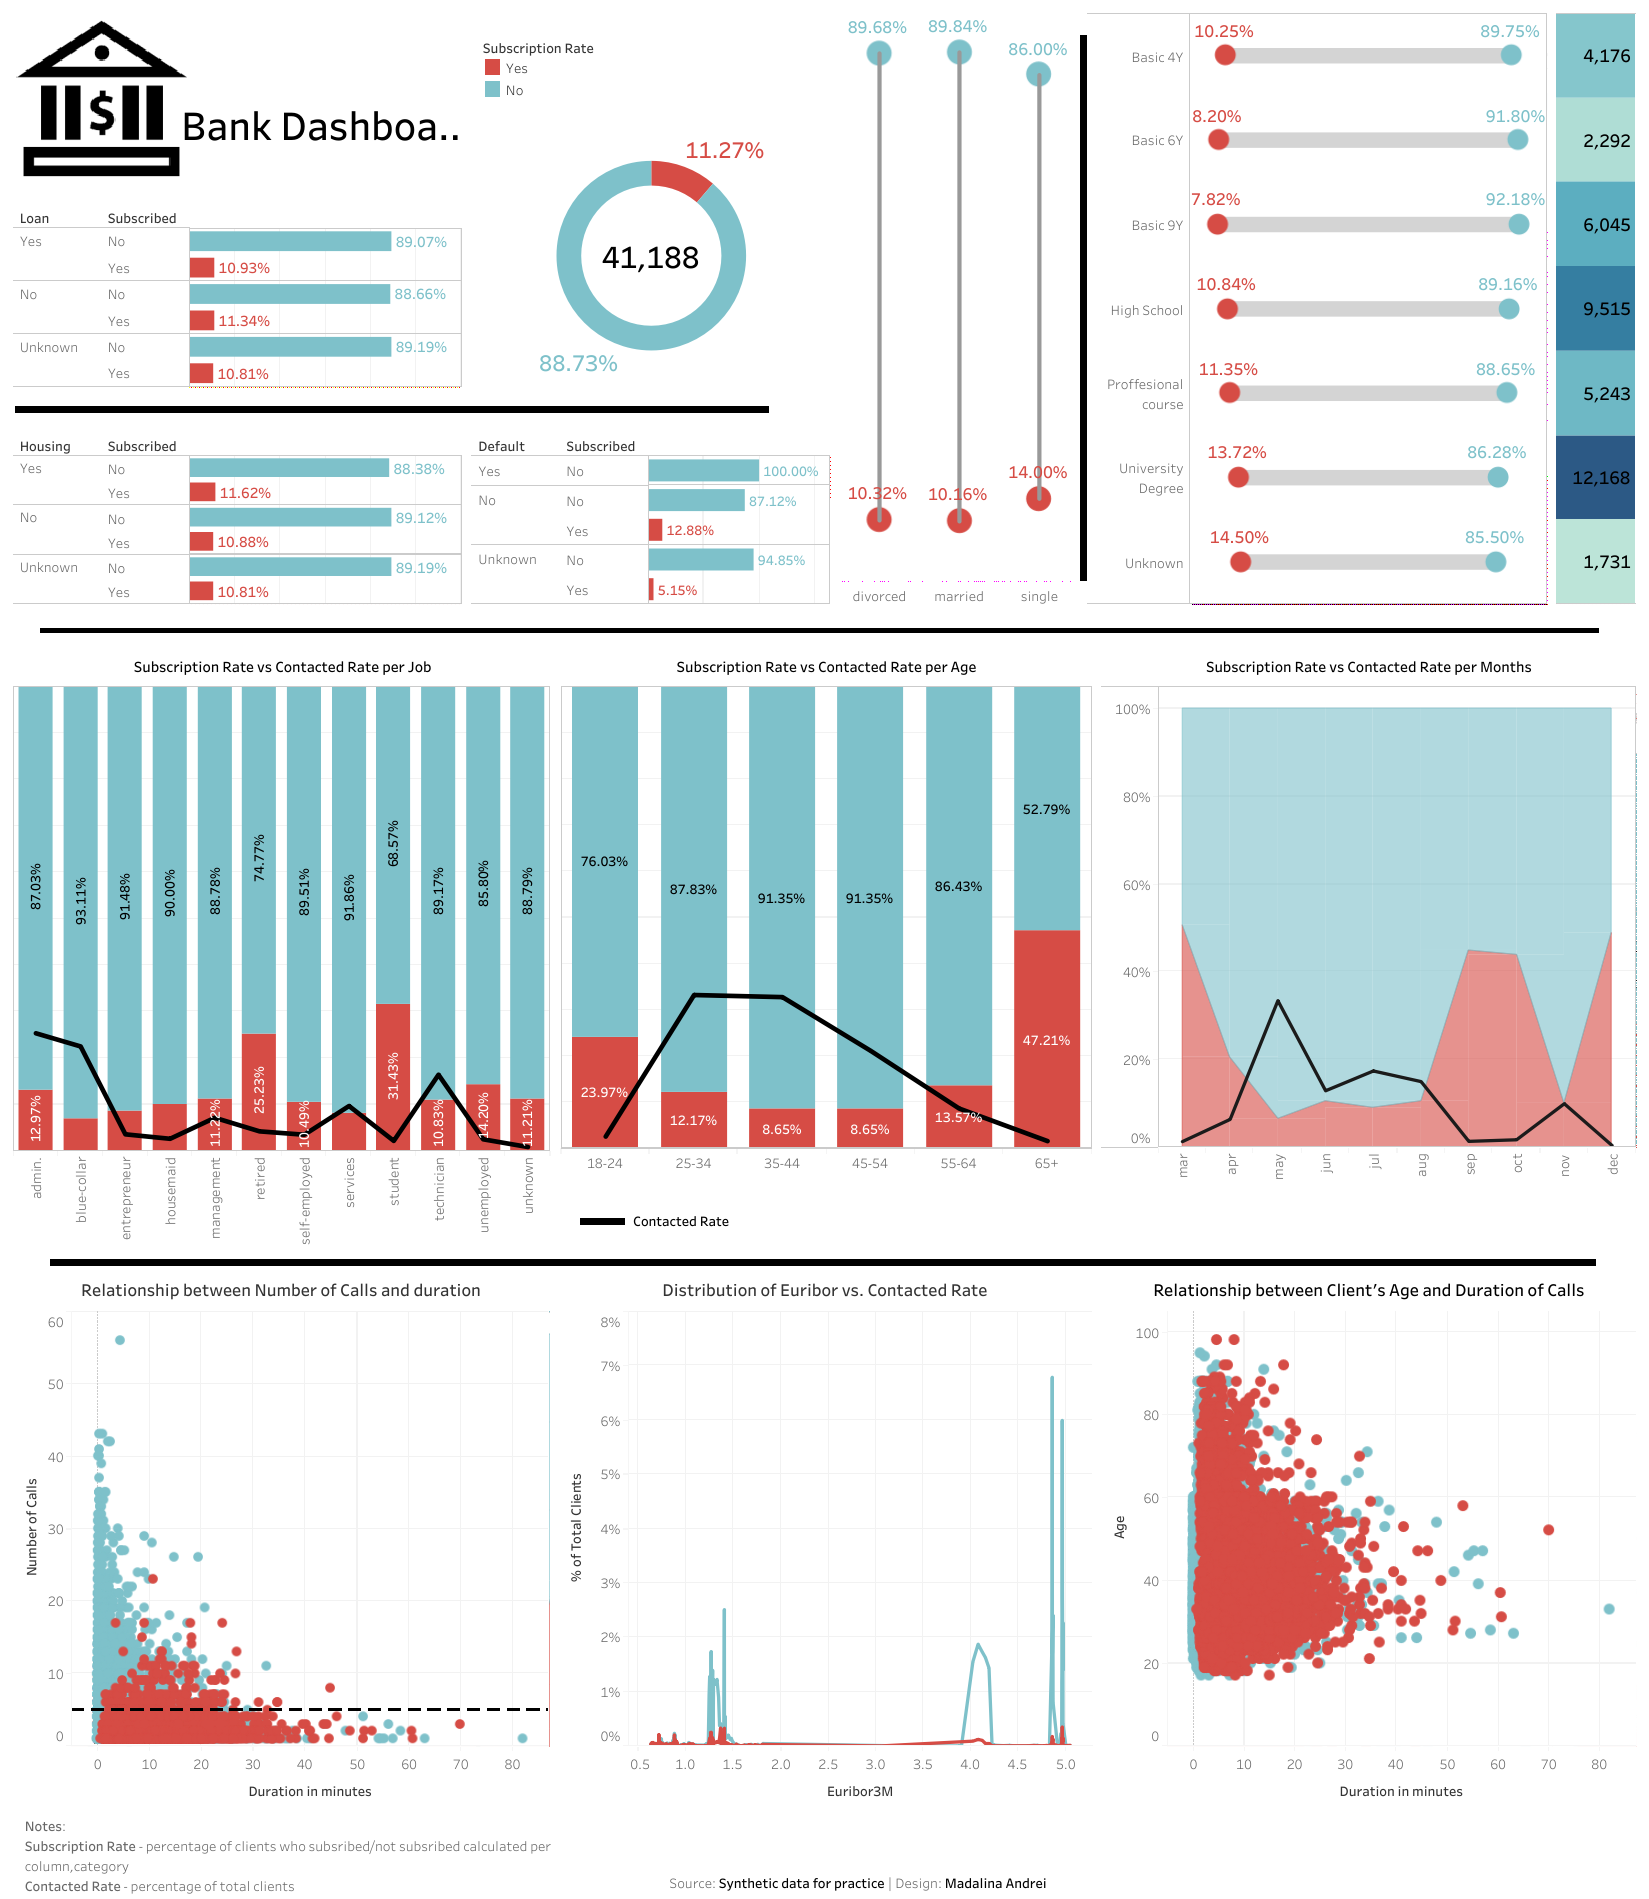
28. Email Subscription Rate
What is it? The number of website visitors who subscribe to your email list out of everyone who visits your site.
Why is it important? Because email marketing is so effective while also being relatively inexpensive. Generally, the more active readers you can have on an email list, the higher your odds of success in a marketing campaign.
How does it relate to other KPIs? It’s all part of the funnel. The more visitors who subscribe, the more potential opens and customers you can have.
Equation: Email Subscription Rate = (Number of Website Visitors Who Subscribe / Total Website Visitors) * 100
Example: Madalina Andrei created a clean (and neat!) dashboard breaking down subscription rates:
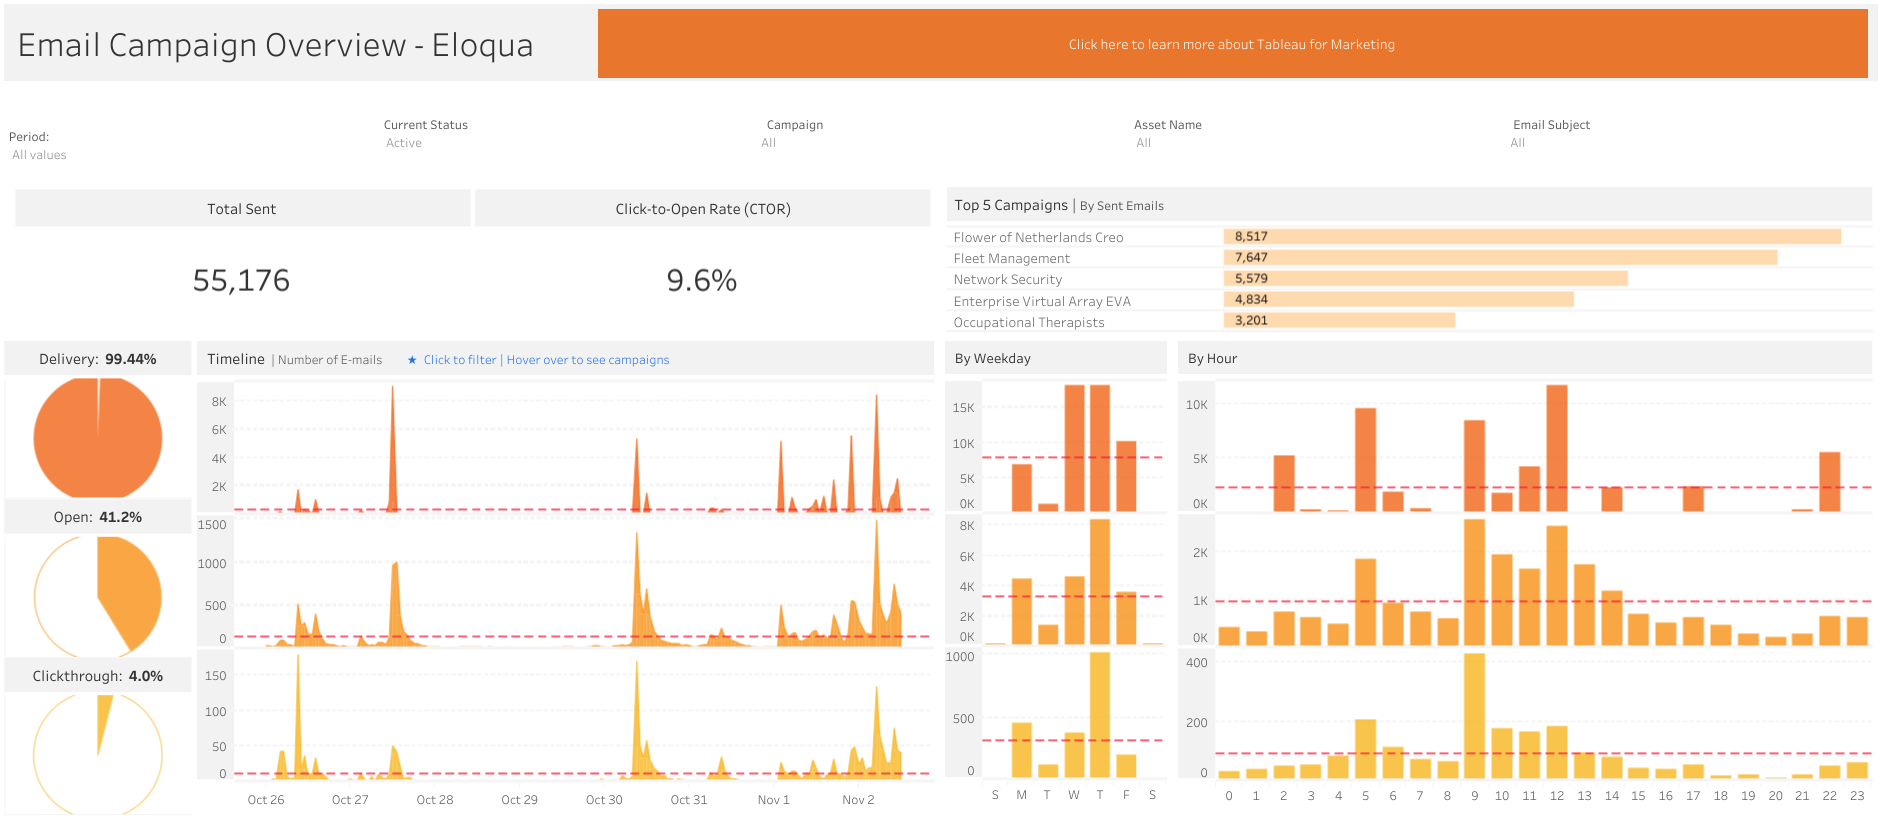
29. Email Open Rate
What is it? Email Open Rate measures the percentage of recipients who open our marketing emails.
Why is it important? Monitoring Email Open Rate helps us assess the effectiveness of our email campaigns.
How does it relate to other KPIs? Email Open Rate affects Email Click-Through Rate and Email Marketing Conversion Rate. Higher open rates lead to more click-throughs and conversions.
Equation: Open Rate = (Total Opens / Total Delivered) * 100
Example: Steve Mostello built this to look at open rates within a marketing campaign:
30. Email Click-Through Rate (CTR)
What is it? Email CTR measures the percentage of email recipients who clicked on one or more links in our emails.
Why is it important? Email CTR indicates the level of engagement and the effectiveness of our email content.
How does it relate to other KPIs? Email CTR is related to Email Open Rate and Email Marketing Conversion Rate. Higher CTR suggests compelling content that drives action.
Equation: CTR = (Total Clicks / Total Opens) * 100
Example: This dashboard was created by Omar Stinner, and it’s excellent:
31. Email Conversion Rate
What is it? Goal Conversion Rate measures how often website visitors complete specific actions set as goals, such as form submissions or purchases.
Why is it important? Goal Conversion Rate evaluates the effectiveness of our website design and calls-to-action, ultimately driving conversions.
How does it relate to other KPIs? Goal Conversion Rate is interconnected with Website Traffic and Average Time to Conversion. Increased traffic and reduced time to conversion positively impact the conversion rate.
Equation: Goal Conversion Rate = (Number of Conversions / Total Website Visitors) * 100
Group 4: Marketing Channels – Social Media
32. Social Media Follower Growth Rate
What is it? Follower Growth Rate indicates the effectiveness of our social media content in attracting new followers.
Why is it important? A higher Follower Growth Rate expands our audience and potential customer base.
How does it relate to other KPIs? Follower Growth Rate is related to Social Media Engagement Rate and Social Media Follower Growth Rate. Engaging content attracts more followers and drives growth.
Equation: Follower Growth Rate = ((New Followers – Lost Followers) / Total Followers at the Start) * 100
Example: Andy Kriebel again has an excellent, immediately understandable, view here:
33. Social Media Engagement Rate
What is it? Engagement Rate measures the level of interaction with our social media content, including likes, comments, and shares.
Why is it important? A higher Engagement Rate suggests successful content that resonates with the audience.
How does it relate to other KPIs? Engagement Rate is related to Social Media Follower Growth Rate and Customer Satisfaction. Higher engagement drives more followers and satisfied customers.
Equation: Engagement Rate = (Total Engagements / Total Followers) * 100
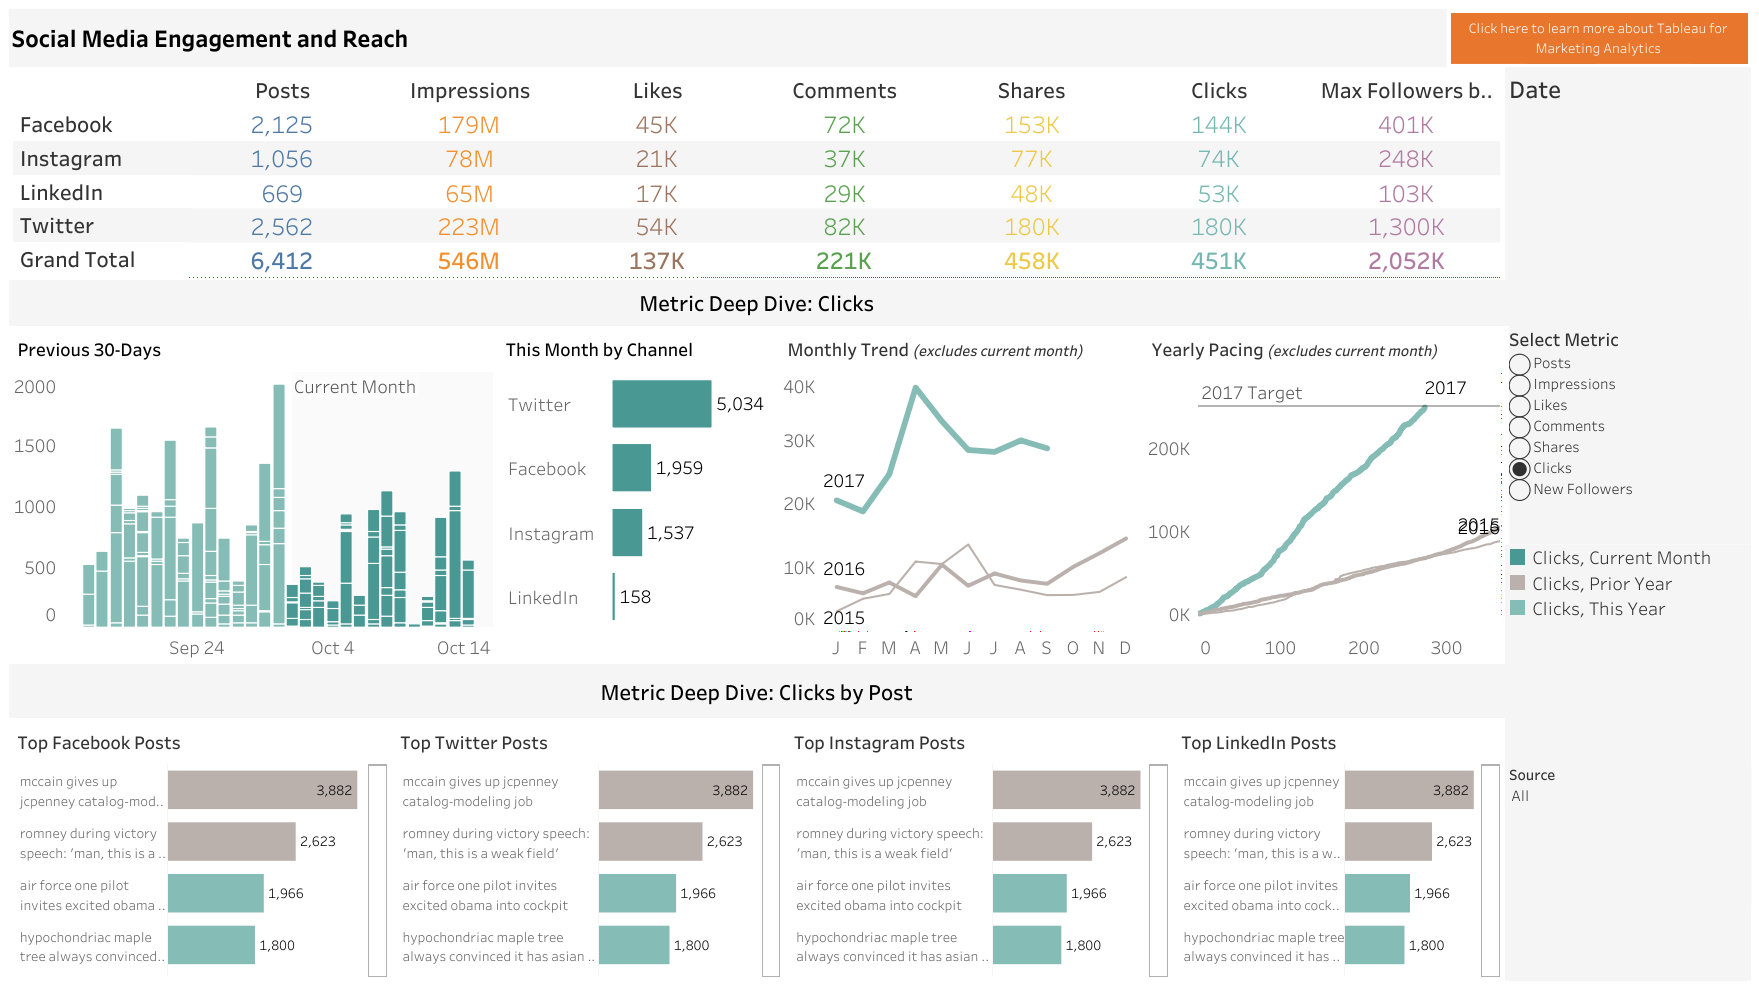
Example: This dashboard was created by Tableau for Marketing and shows engagement across multiple social media channels:
34. Social Media Share of Voice
What is it? The amount of [something] that your brand owns out of all competitors in the industry. It’s effectively how much of the conversation on social media about your industry or niche actually has to do with you. That [something] can be measured in anything from mentions and hashtags to impressions.
Why is it important? It’s a branding measure. Are you top-of-mind when your topic comes up?
How does it relate to other KPIs? Generally, the higher Share Of Voice, the higher your odds of converting prospects into leads and/or customers. It’s related to referrals in a way. The more familiar your brand is with the public, the more likely you are to be in the conversation when they’re buying.
Equation: We’ll give the example for mentions, but the formula is the same for others:
(Count – Mentions of Your Brand / Total Mentions) * 100
35. Social Media Conversion Rate
What is it? A very important factor in any online marketing strategy, Conversion Rate measures the percentage of website visitors who complete a specific goal, such as making a purchase or signing up for a newsletter. Those can be wildly different outcomes, so expectations must be tempered. If the goal you’re measuring to is newsletter signups, you’re going to see a much higher conversion rate than if your goal is purchases.
Why is it important? A higher Conversion Rate indicates successful conversion optimization efforts.
How does it relate to other KPIs? Conversion Rate impacts Customer Acquisition Cost (CAC) and Return on Advertising Spend (ROAS). Higher conversion rates lead to lower CAC and better ROAS.
Equation: Conversion Rate = (Number of Conversions / Total Website Visitors) * 100
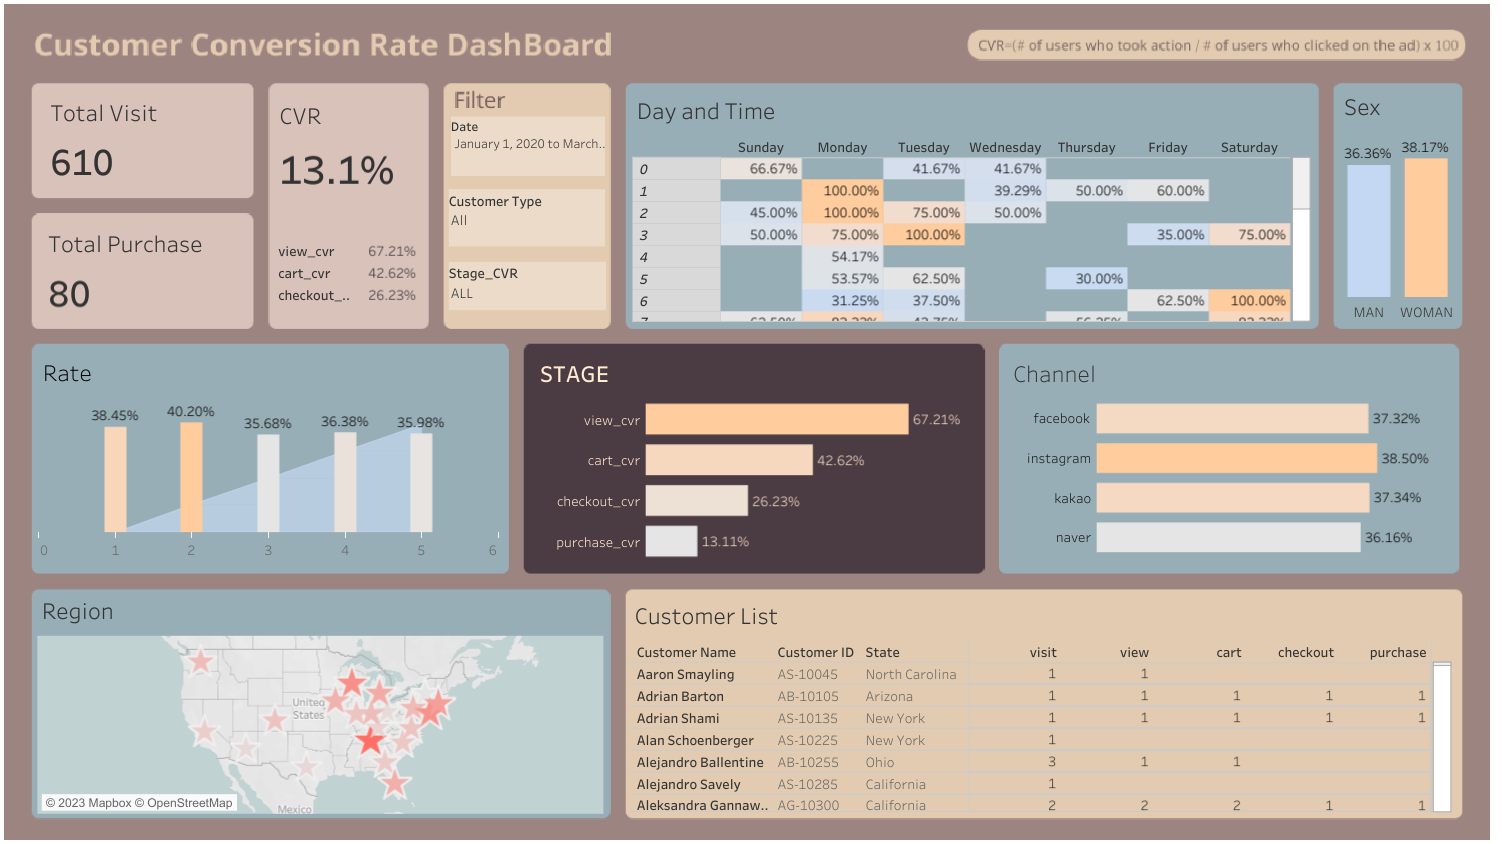
Example: Seohyemin has created a beautiful dashboard (seen below) showing conversions and which customers converted.
Conclusion
KPIs play a vital role in marketing: they help the team to 1) build an effective marketing strategy that gives their marketing team direction and focus, 2) know exactly which metrics need to be measured to build their KPIs, and 3) measure the effectiveness of their efforts, so that they can better allocate marketing budget in the future. Each key performance indicator shows the health of a step of the marketing pipeline and the maturity of their tactics. Together, they let the marketing department work as a team with a shared vision, allowing it to make data-driven decisions and optimize campaigns. By leveraging this comprehensive list of KPIs, we empower our employees to navigate the dynamic marketing landscape with confidence, achieving sustainable growth, customer satisfaction, and long-term success.
Pingback: Email Subscription Rate | KPI Deep Dive - Dashboard Exchange