Unlocking Business Success: 10 Sales KPIs, Their Impacts, and How They’re Related
Introduction
In the fast-paced world of business, understanding and optimizing sales performance is essential for achieving success. As a Sales Analytics Director, my primary goal is to utilize data-driven insights to enhance the effectiveness of our sales team. One of the most powerful tools at my disposal is the set of Key Performance Indicators (KPIs) designed to measure and evaluate our sales performance. In this comprehensive guide, we will delve deep into each KPI, its importance, and how they interconnect to shape the trajectory of our business.
Section 1: Understanding the Fundamentals of Sales KPIs
What are Sales KPIs?
Sales KPIs, or Key Performance Indicators, are measurable metrics that provide a quantitative assessment of various aspects of the sales process. These indicators act as vital signposts for the health of our sales efforts and help us identify strengths and weaknesses.
The Importance of Sales KPIs
Sales KPIs are critical for several reasons:
1. Performance Evaluation: KPIs allow us to assess the performance of our sales team, individual representatives, and the organization as a whole accurately.
2. Goal Alignment: By setting specific KPIs, we align the sales team’s efforts with the overall business objectives, ensuring everyone is working towards the same goal.
3. Data-Driven Decisions: With KPIs at our disposal, we can make informed decisions backed by real data, increasing the likelihood of successful outcomes.
4. Continuous Improvement: Regularly monitoring KPIs enables us to identify areas for improvement and implement targeted strategies to enhance sales performance.
Section 2: Core Sales KPIs for Success
Now, let’s explore the key sales KPIs that shape the success of our sales team and ultimately the entire organization:
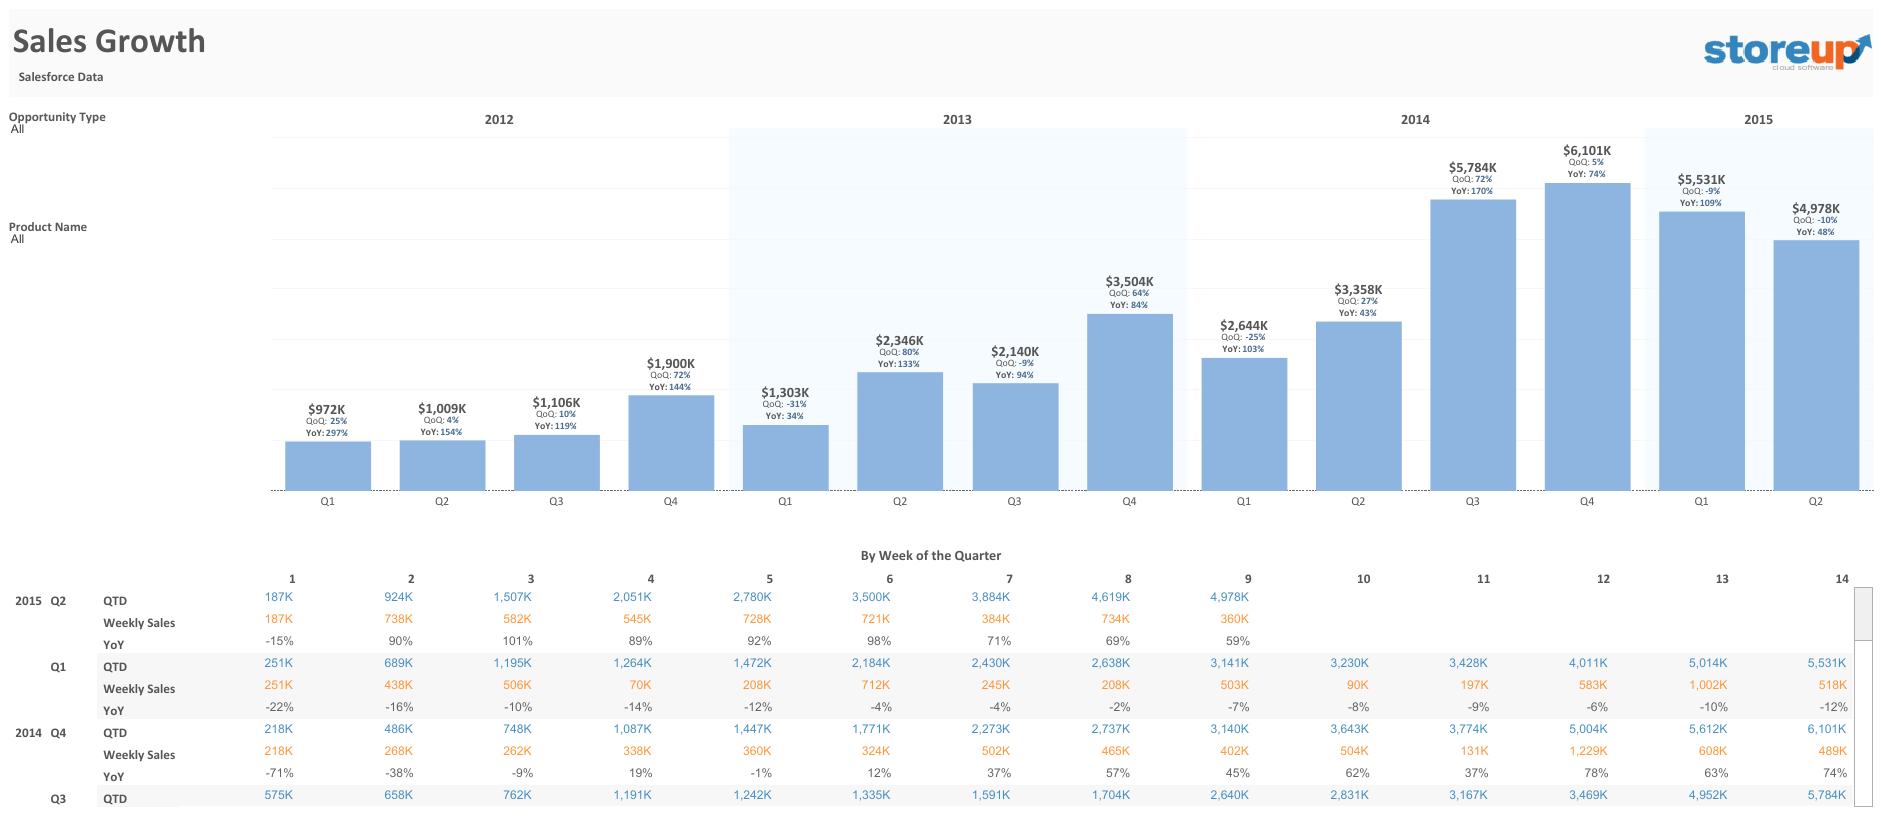
1. Sales Growth
Metrics Needed:
Calculation: ((SALES | THIS PERIOD) – (SALES | LAST PERIOD)) / (SALES | LAST PERIOD)
Sales Growth measures the increase in sales revenue, units, or margin over a specific period. It helps us understand the effectiveness of our sales strategies and whether we are gaining traction in the market.
The dashboard below, by Miranda Li, does a great job of showing quarterly sales growth over time with just a few filters.
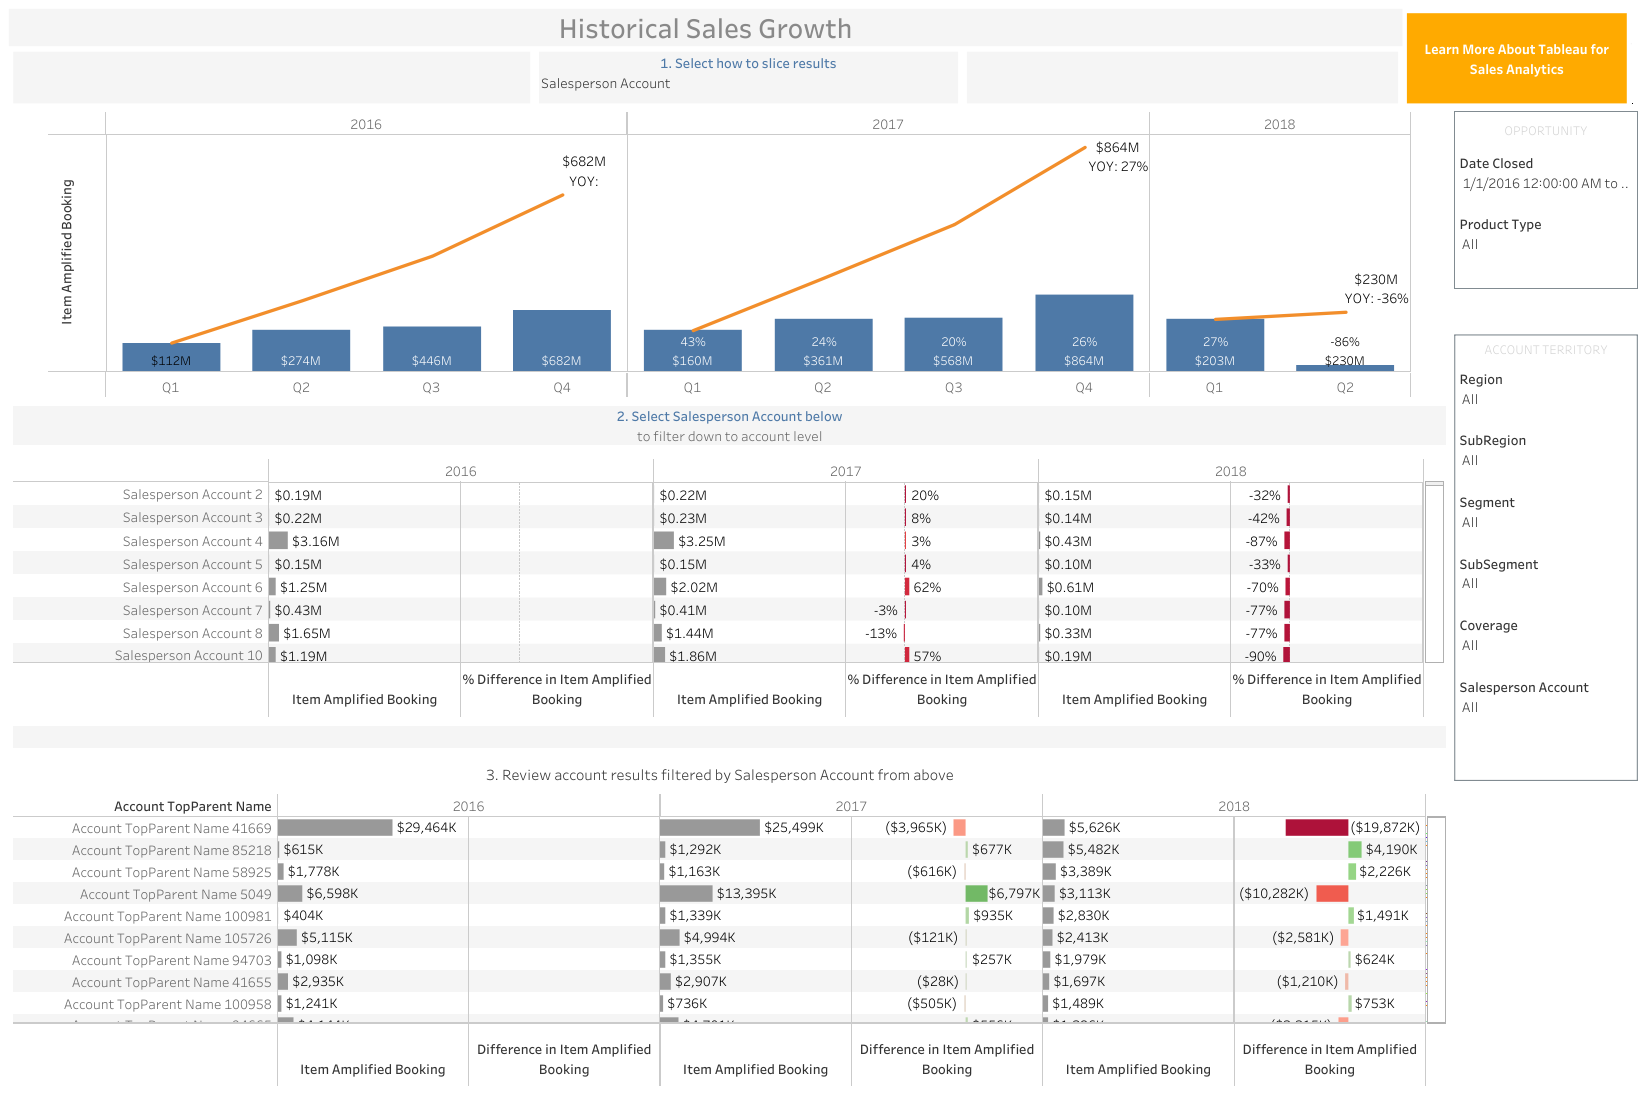
Going from the simple to complex, Tableau has its own Sales Growth dashboard, complete with a myriad of filters for Sales Rep, New Customers (now included as an entry in ‘Sub-Segment’), and showing revenue generated over that time.
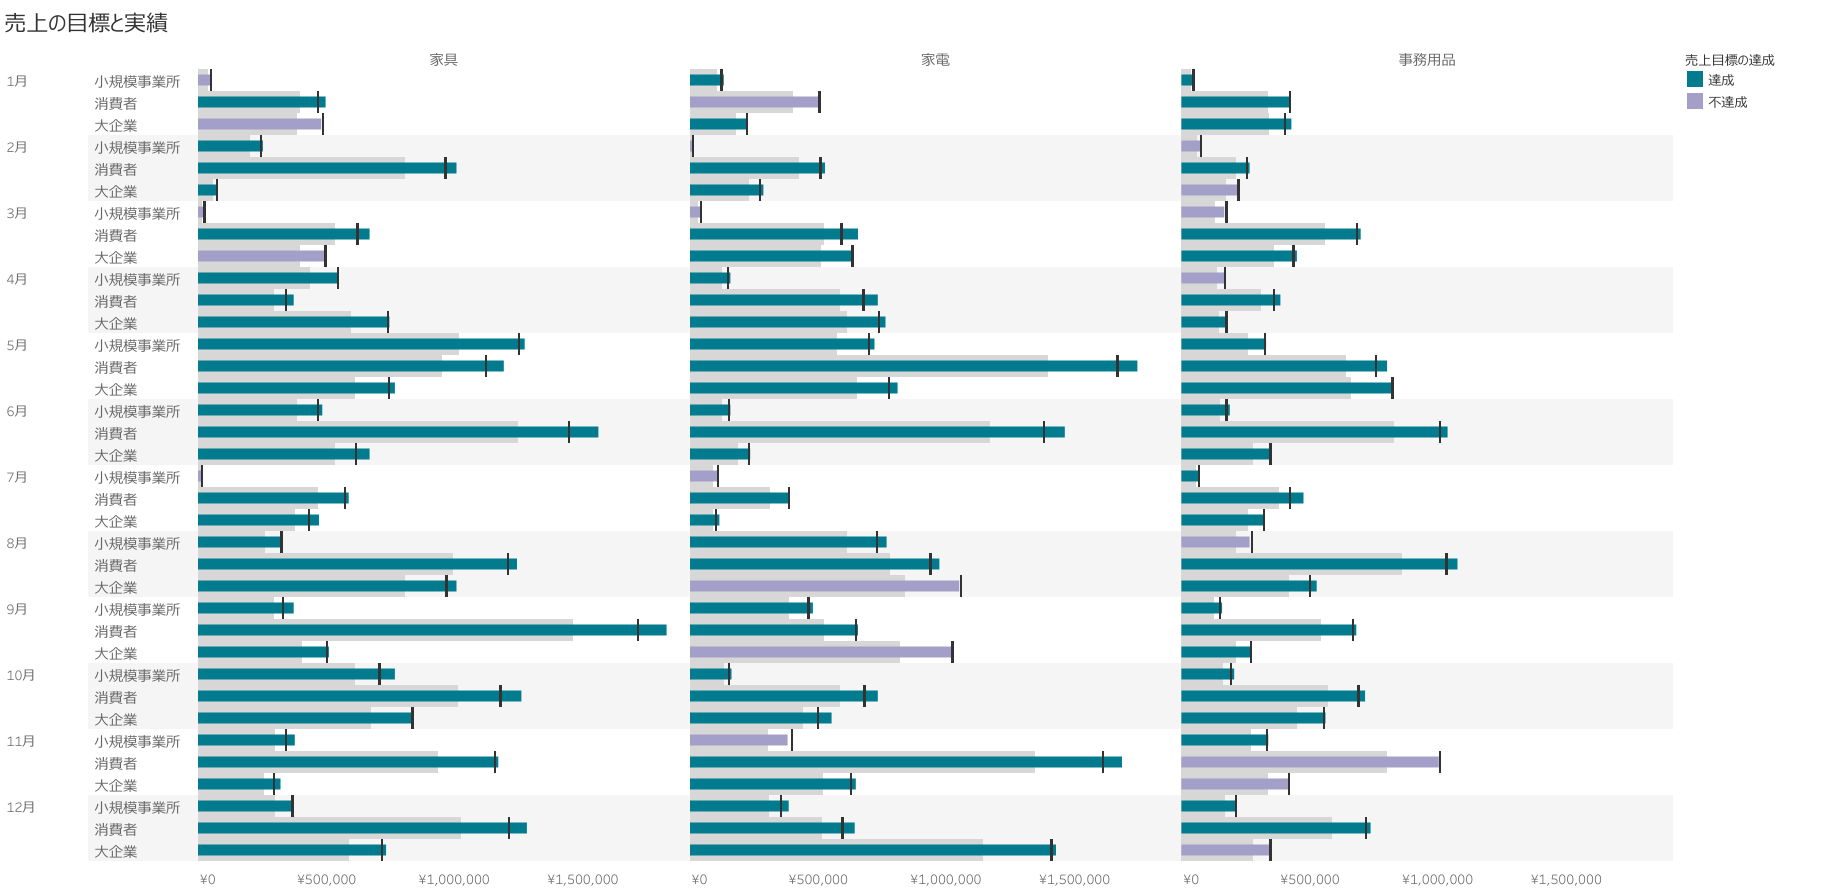
2. Sales Target Achievement, AKA Percent To Quota (PTQ)
Metrics Needed:
Calculation: (SALES) – (SALES TARGET)
This KPI evaluates how well our sales team meets the targets and quotas set for them. Sales Targets are a crucial indicator of the team’s performance against predetermined objectives, and they can be shown very simply with bullet charts, as Rintaro Sugimura does here, with those reaching their goals highlighted in purple:
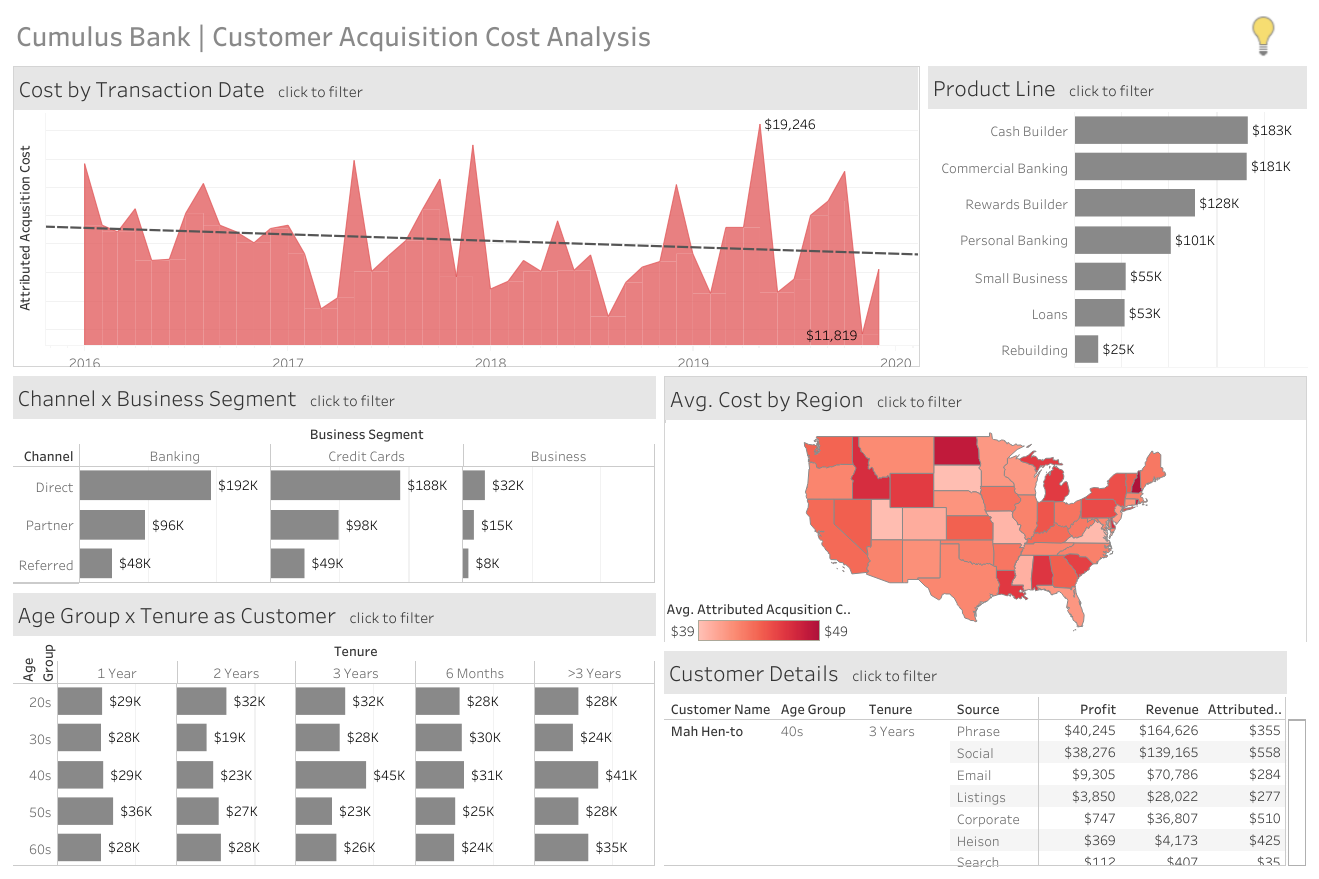
3. Customer Acquisition Cost (CAC)
Metrics Needed:
Calculation: (COST – DIRECT MARKETING) / (TOTAL CUSTOMERS ACQUIRED)
CAC is one of the most important sales performance metrics that sales managers can monitor. It is the total cost of acquiring a new customer, taking into account marketing, sales, and related expenses. A lower CAC indicates a more efficient and cost-effective sales process. At a purely theoretical level, if the Customer Acquisition Cost is Higher than the Customer Lifetime Value (CLV), that product or business will fail. On the other hand, if CAC is less than CLV (typically for one marketing channel), then the company should acquire as many customers through that channel as possible.
The dashboard below, by Robert Barnhart, shows Customer Acquisition Cost by product, segment, region, and customer:
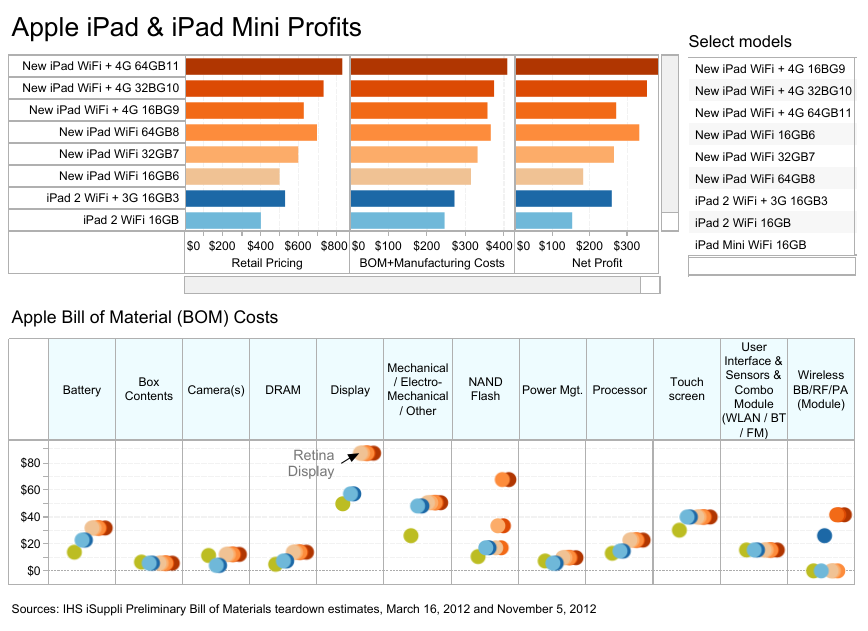
4. Average Margin per Unit
Metrics Needed:
Calculation: (MARGIN $) / (SALES UNITS)
Average Margin per Unit tells us how much profit we generate from each product sold, enabling us to gauge the value our products or services bring to customers. It shows the immediate impact of acquiring a new customer. For example: if a new customer purchases X units at Y Margin Per Unit, we will make a profit today.
Relating this to consumer electronics, Brett Sheppard shows this for iPads below:
5. Customer Lifetime Value (CLV or CLTV)
Metrics Needed:
- TOTAL SALES | PAST CUSTOMERS
- TOTAL COUNT | PAST CUSTOMERS
Calculation: (TOTAL SALES | PAST CUSTOMERS) / (TOTAL COUNT | PAST CUSTOMERS)
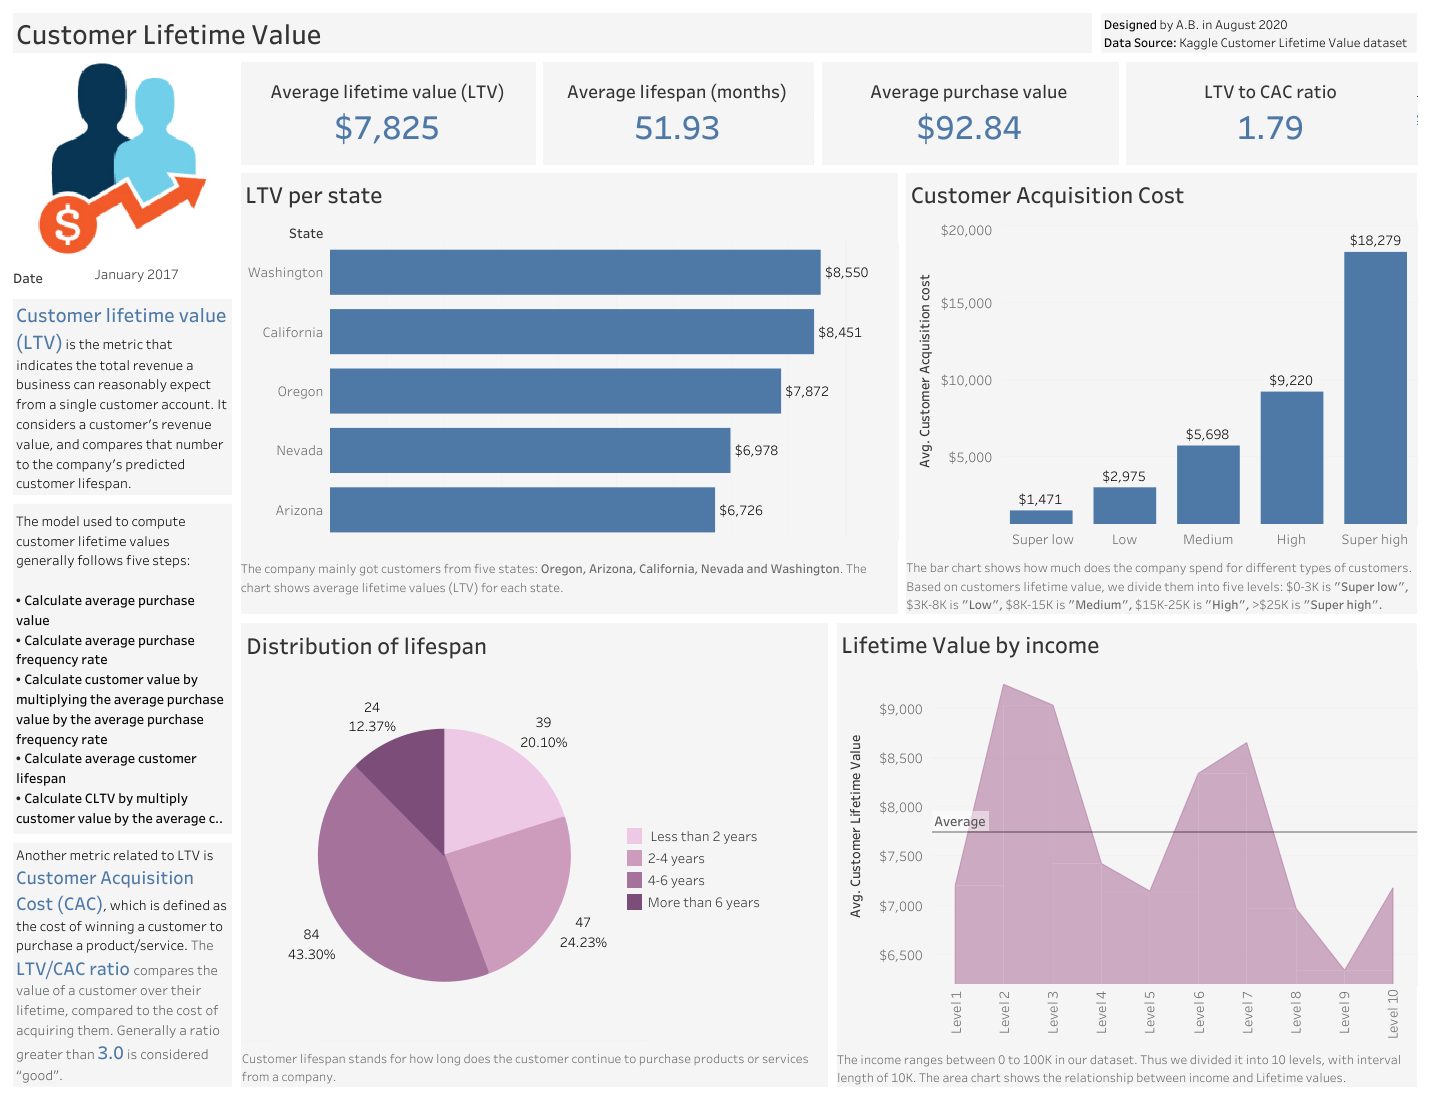
Customer Lifetime Value, which is abbreviated as CLV or CLTV, assesses the long-term value of a customer to our business. This is everything from the first purchase to the last. It can be a complicated metric, as current customers have not exhausted their CLV; they are still buying. We have to extrapolate where a current customer may be on the lifetime value curve by using data from previous customers. Understanding CLV – and how far along a current customer may be on their journey – helps us make strategic decisions regarding customer retention, loyalty programs, and marketing.
There are hundreds of excellent views of CLTV out there. We’ve chosen a few, starting with Michele Lanning‘s below. She does a great job of explaining each metric without cluttering the dashboard. Also, she explains the heuristic for the LTV/CAC ratio, which we’ll cover below.
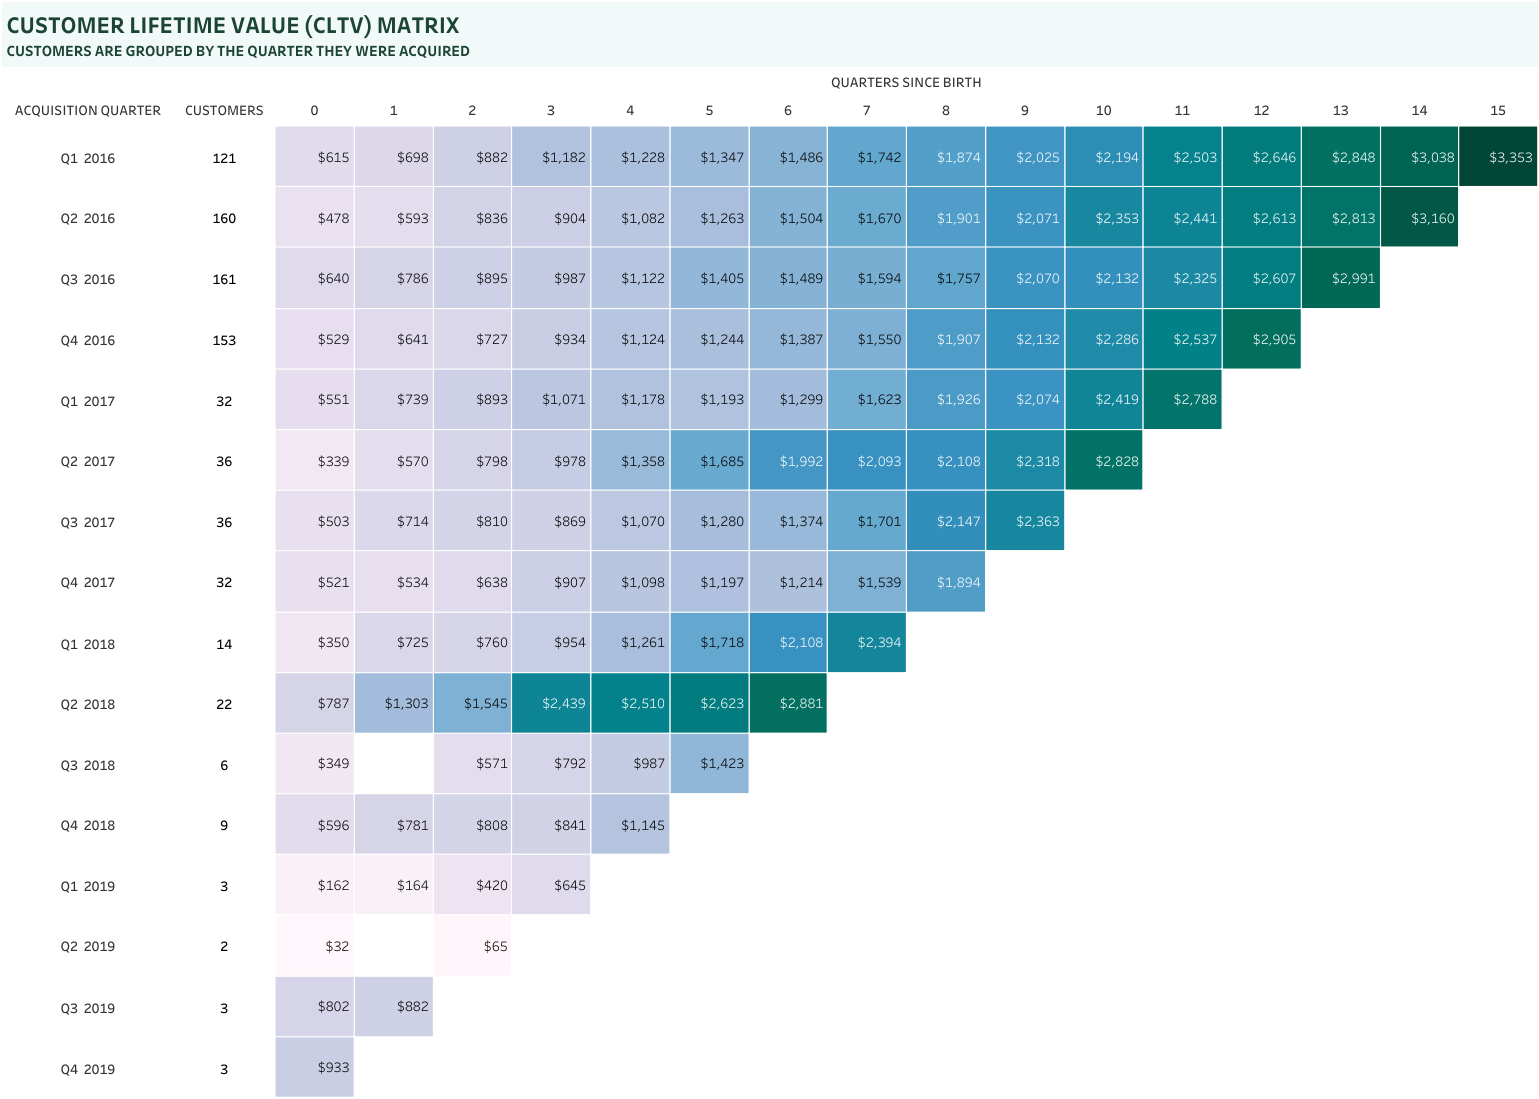
Duygu Unaldi created an interesting view of the CLTV Matrix. It’s the margin generated by customer plotted by date in two dimensions, and it does a good job of showing which quarters’ product and marketing efforts were more or less successful. Hard to explain, so take a look:
6. Customer Churn Rate
Metrics Needed:
Calculation: ((COUNT – CUSTOMERS | PERIOD 1) – (COUNT – CUSTOMERS | PERIOD 0)) / (COUNT – CUSTOMERS | PERIOD 0)
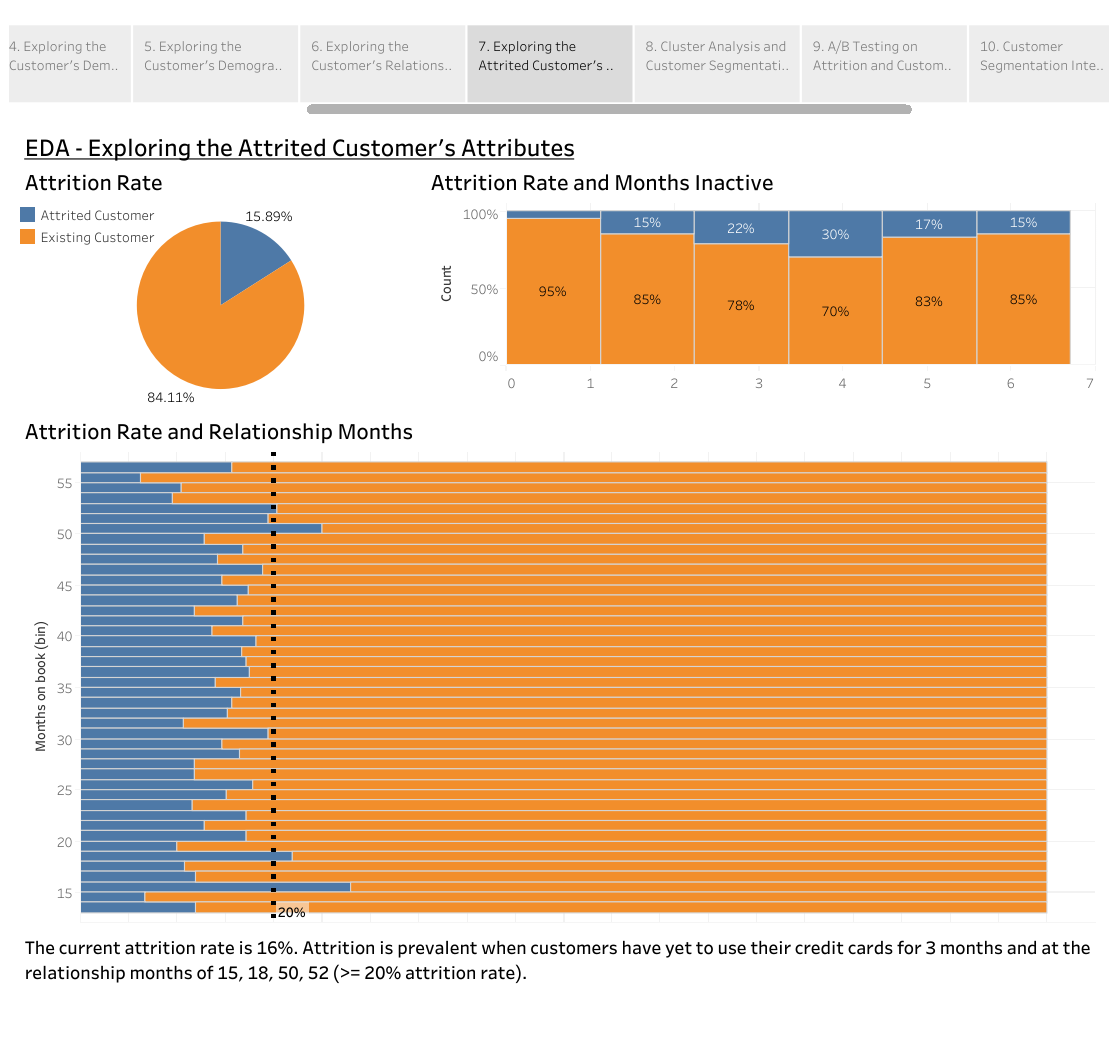
Customer Churn Rate measures the percentage of customers who stop using our products or services over a specific period. A high churn rate signals a need for improved customer satisfaction and retention efforts.
While it depends heavily on the product and revenue generated (one-time sale or monthly recurring revenue?), a decent guideline is to keep churn below 10%, though for some businesses it can range from 3% to upwards of 25%. More than that, and you’ll spend more time chasing after qualified leads than nurturing your existing customers.
To that end, if your churn is high, it can pay huge dividends to improve your relationship with your customers to reduce churn, rather than chasing after sales. If a sale today is going to churn tomorrow, then customer acquisition costs will eat you alive before the business can deliver its product. A change in sales strategy – which typically must come from the sales leaders themselves – is necessary to keep the business alive.
Tableau user Jason8658 shows this for credit cards below:
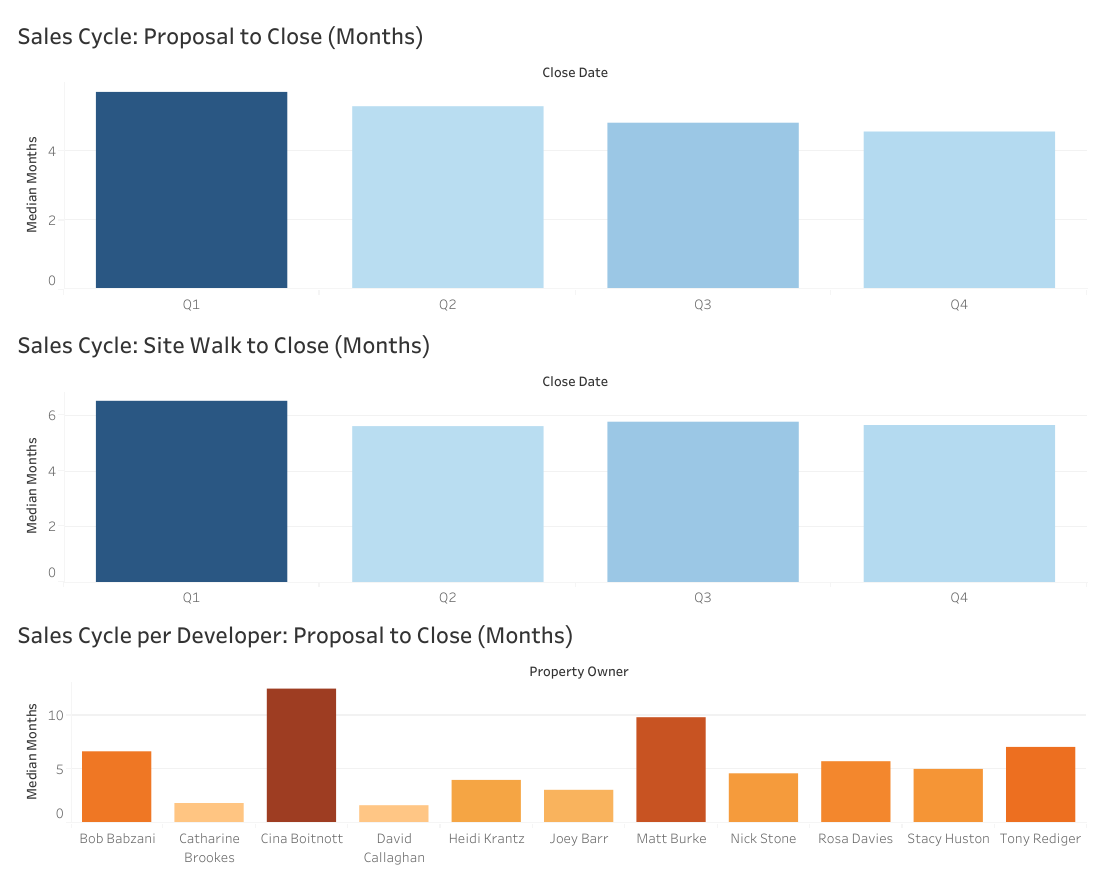
7. Average Sales Cycle Length
Metrics Needed:
Calculation: (SALES DAYS) / (COUNT – NEW CUSTOMERS)
This KPI tracks the average time it takes to convert a lead into a paying customer. Reducing the sales cycle length can lead to faster revenue generation.
Kate Gridley shows this simply and effectively for the previous four quarters in her dashboard here:
8. Lead-to-Opportunity Ratio
Metrics Needed:
Calculation: (COUNT – SALES OPPORTUNITIES) / (COUNT – QUALIFIED LEADS)
Lead-to-Opportunity Ratio shows the effectiveness of our lead qualification process. It’s answering the question, “How many of our leads turn into opportunities?” A higher ratio indicates that we are successfully converting more leads into potential opportunities.
Mohamed Jaffar shows the relationship between opportunities and sales qualified leads, along with the lead conversion rate in his dashboard below:
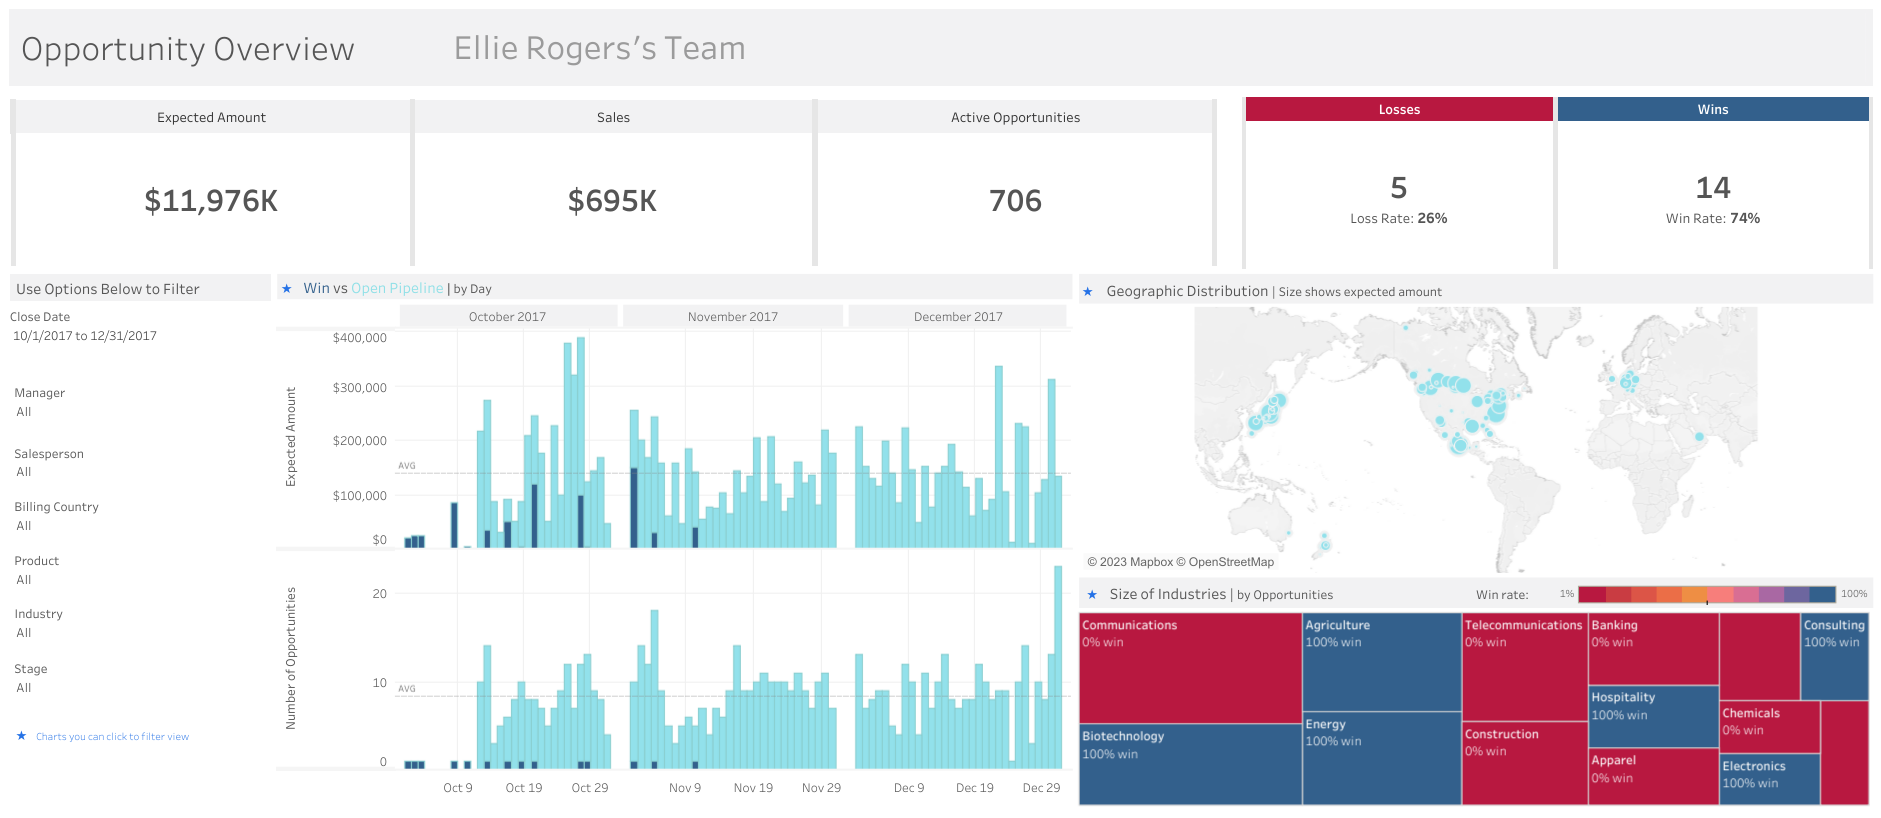
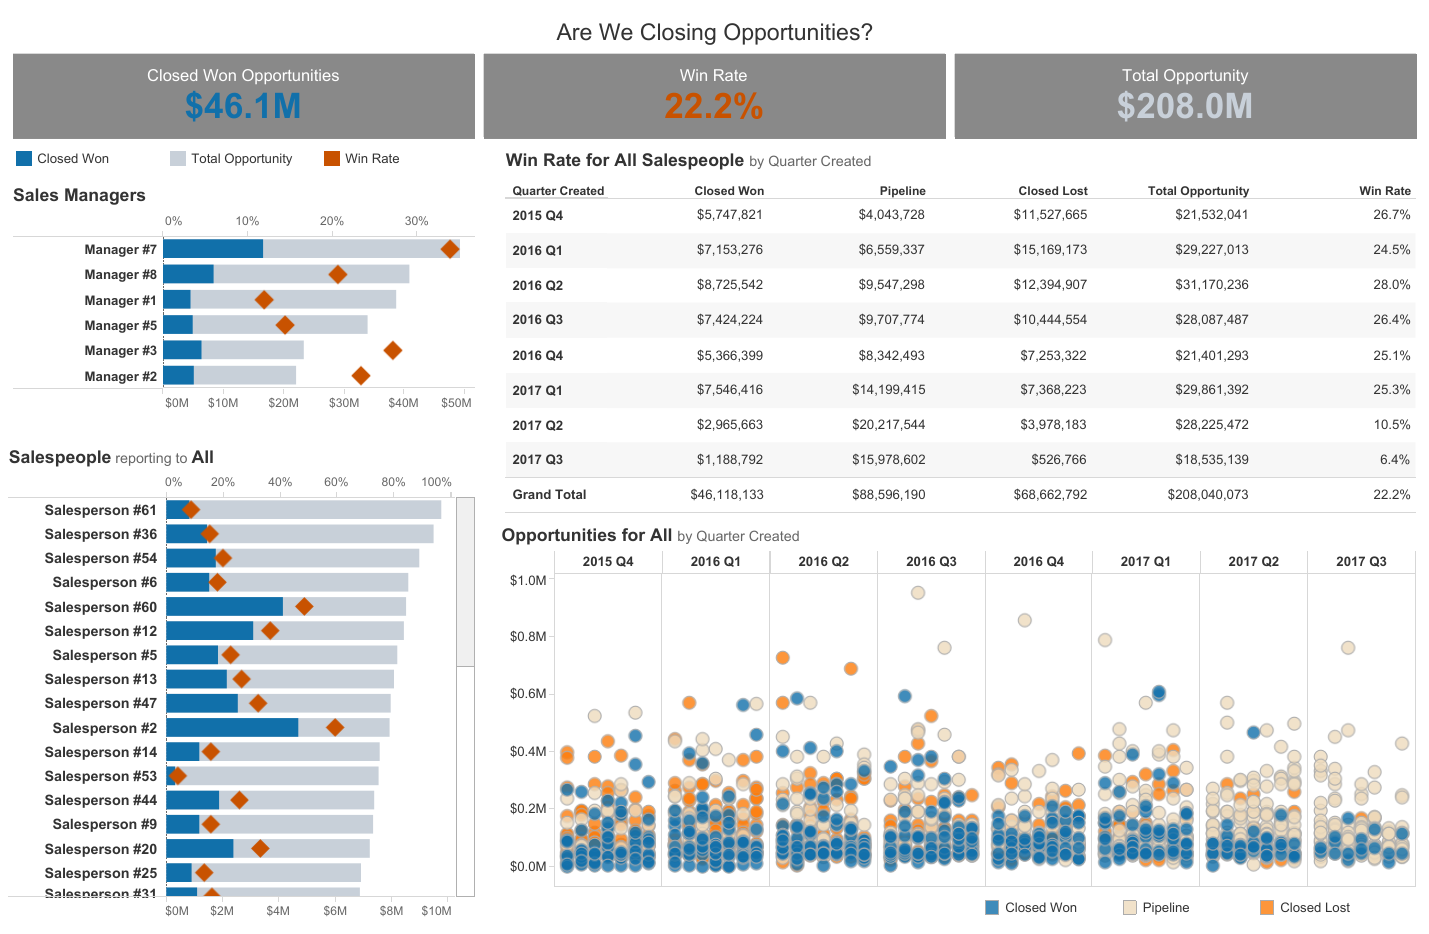
9. Opportunity-to-Win Ratio
Metrics Needed:
Calculation: (COUNT – SALES GENERATED) / (COUNT – SALES OPPORTUNITIES)
This KPI shows the proportion of opportunities that ultimately result in successful sales. A higher ratio signifies an efficient and effective sales process. The win rate is shown in the dashboard below from Tableau For Sales Analytics:
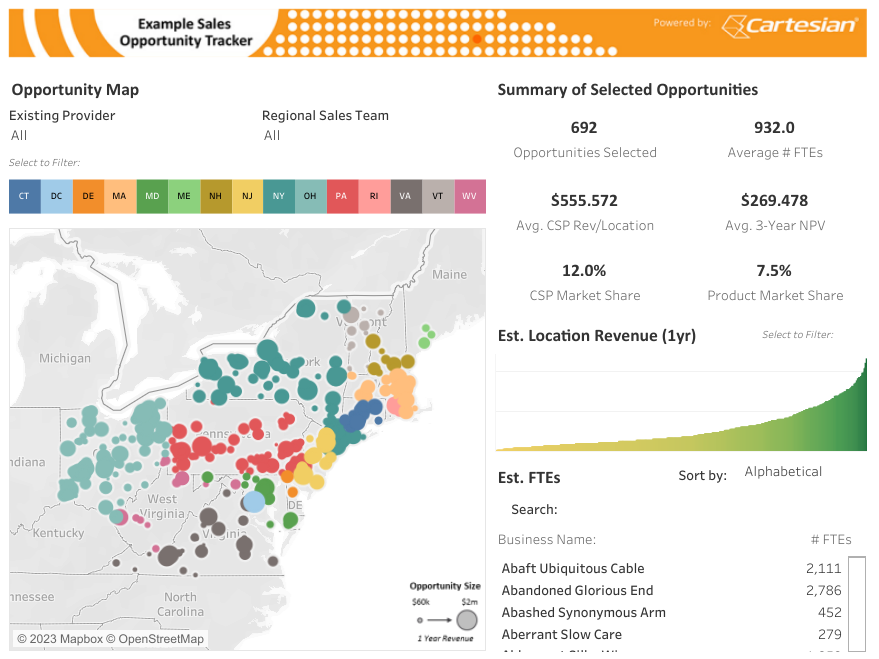
This is another interesting view, this time by Cartesian, shows them tracking sales opportunities by region, team, provider, and deal value.
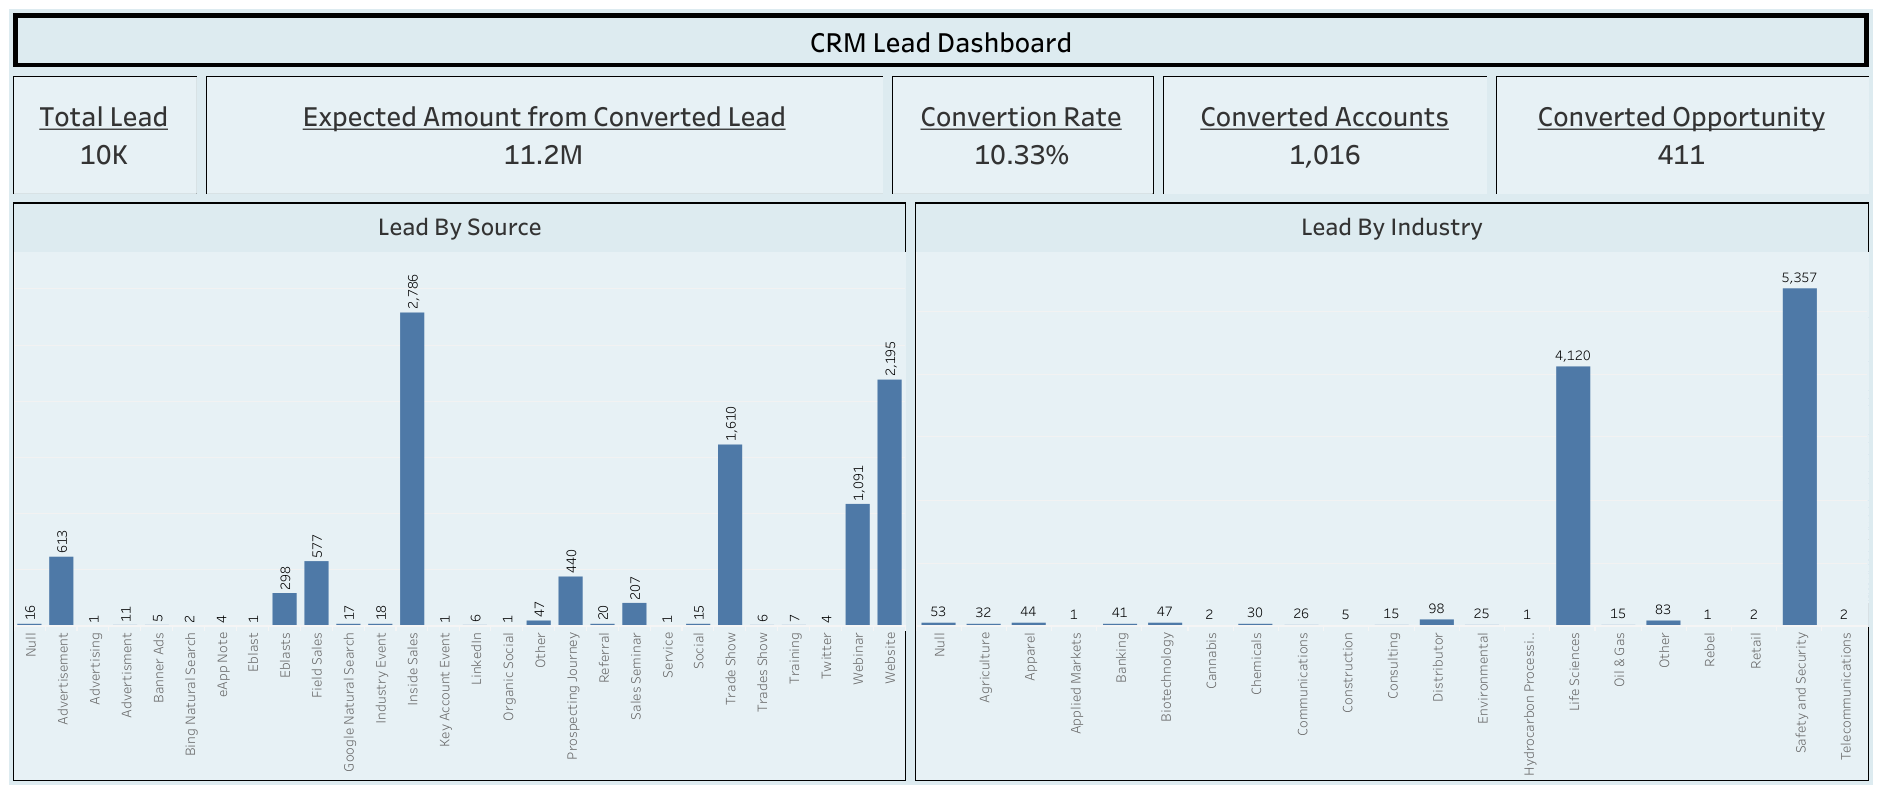
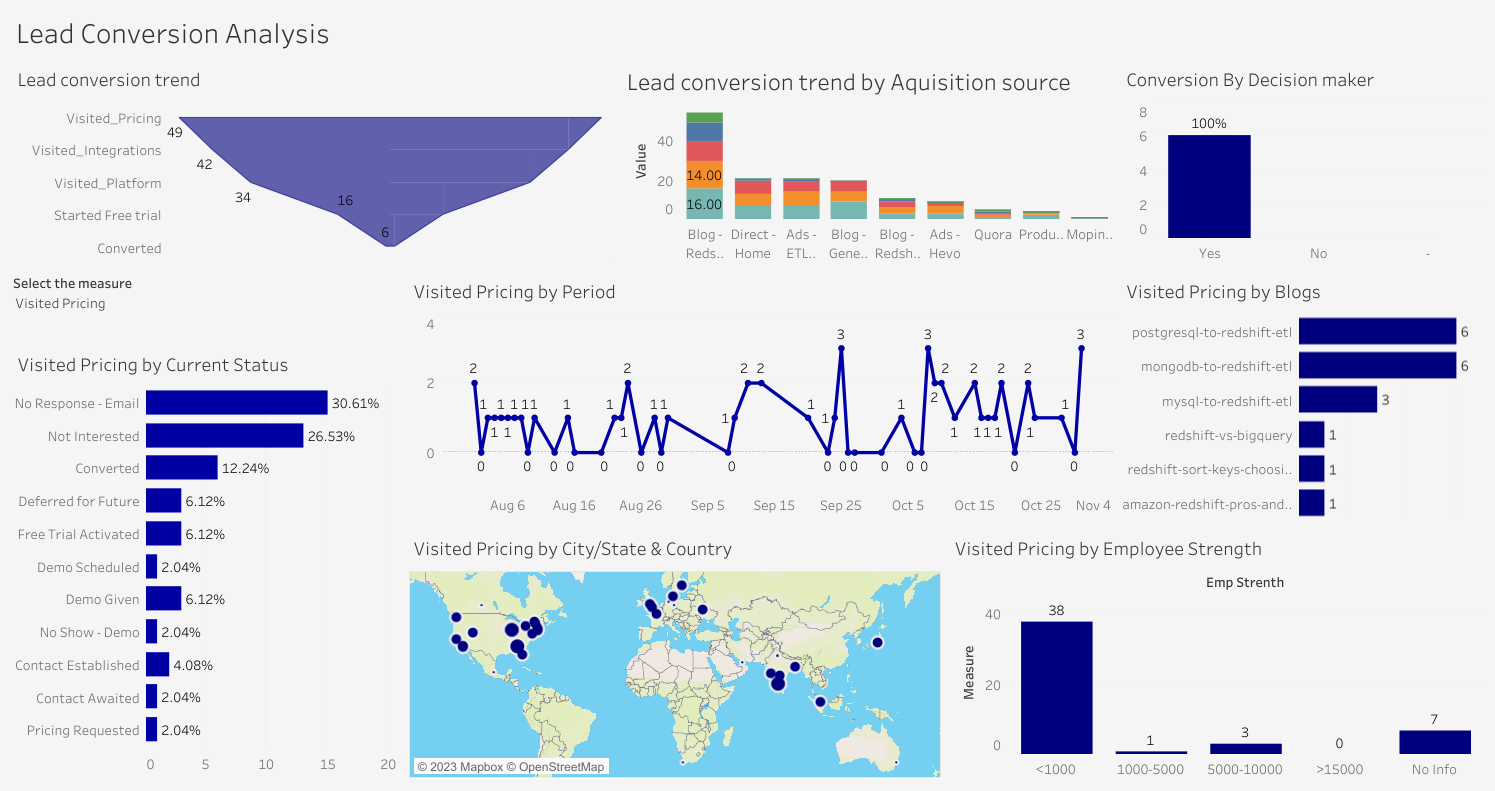
10. Lead Conversion Ratio
Metrics Needed:
Calculation: (COUNT – SALES GENERATED) / (COUNT – SALES QUALIFIED LEADS)
Lead Conversion Ratio measures the percentage of leads that turn into actual paying customers. A higher conversion ratio demonstrates the sales team’s ability to close deals successfully.
Abishek VK shows this well in this dashboard. Additionally, he shows the sales funnel and the cost per lead associated with each method, status, and period.
Section 3: The Relationships Between Sales KPIs
Now that we have explored the fundamental sales KPIs let’s examine how some of these metrics are interconnected and the impact they can have on each other:
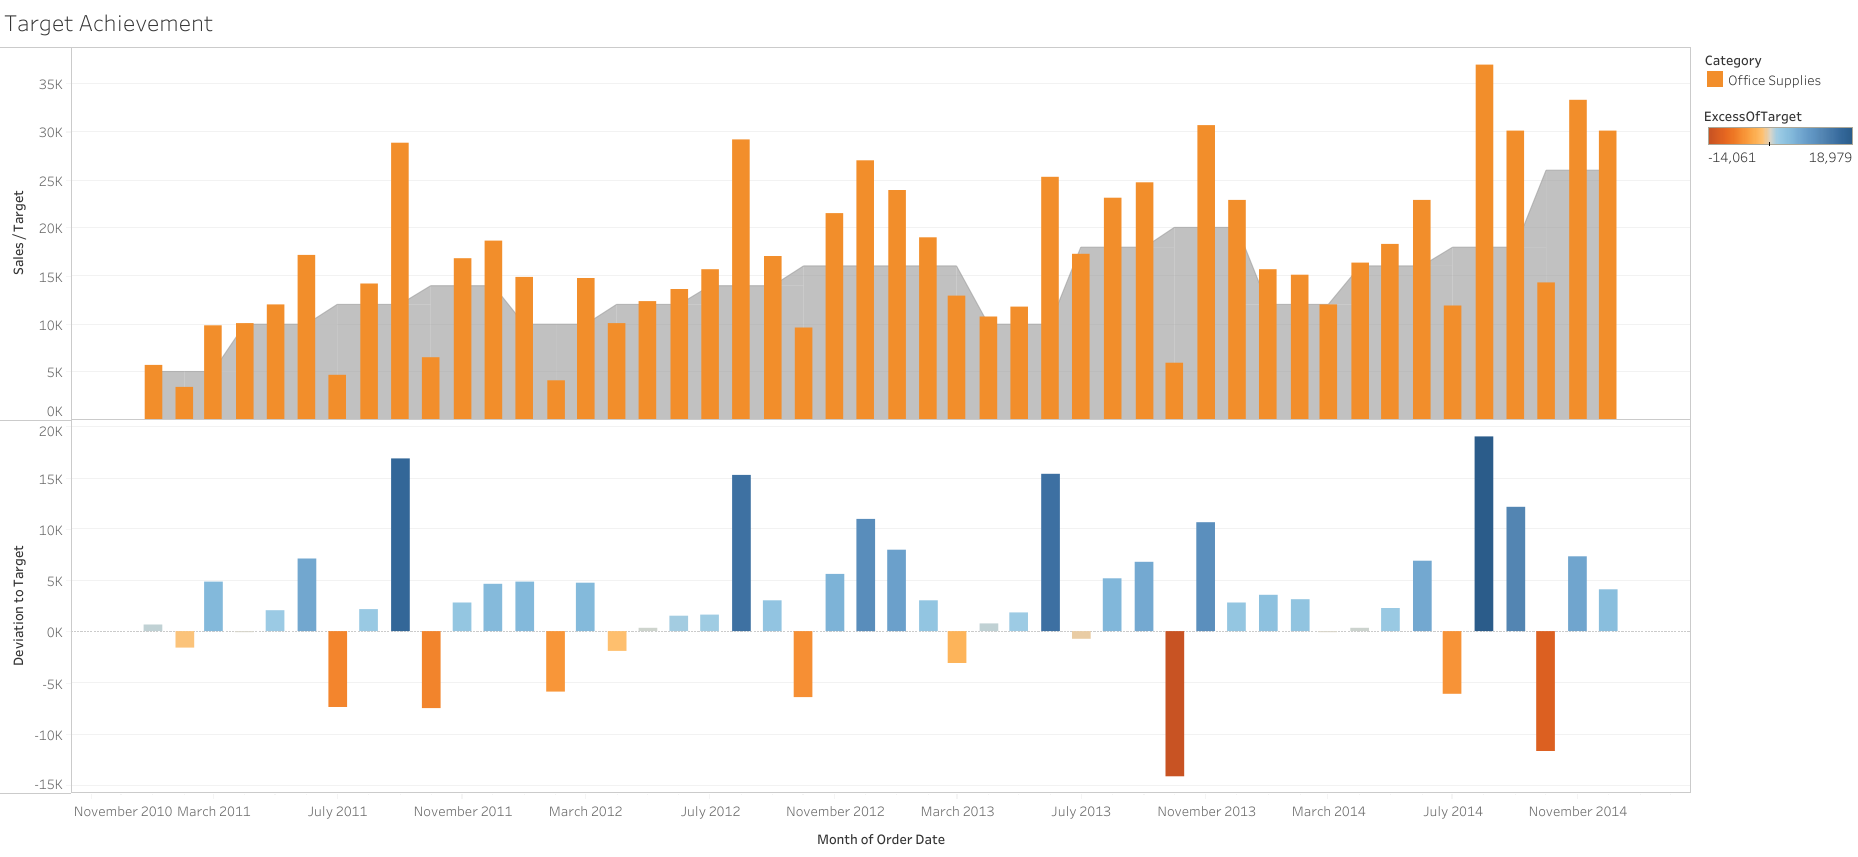
1. Sales Growth and Sales Target Achievement
Sales Growth and Sales Target Achievement go hand in hand. When our sales team achieves its targets consistently, it positively impacts overall sales growth. Meeting targets means the team is effectively executing their strategies and driving revenue generation.
Alexander Dethloff shows sales target achievement very simply in the dashboard below:
2. Customer Acquisition Cost (CAC) and Customer Lifetime Value (CLV)
These KPIs are linked as they both relate to customer acquisition and retention. By lowering the CAC and increasing the CLV, we improve the return on investment for each customer acquired, maximizing their long-term value to the organization.
3. Sales Win Rate and Average Deal Size
The Sales Win Rate and Average Deal Size have a symbiotic relationship. When our sales team effectively closes more deals (high win rate), and those deals are of larger sizes, it directly impacts revenue growth.
Melanie Manning very clearly shows the relationship between Win Rate and Average Deal Size in her dashboard below:
4. Sales Pipeline Value and Sales Conversion Rate
A healthy Sales Pipeline Value, comprising numerous opportunities, often leads to a higher Sales Conversion Rate. The more opportunities we have, the greater our chances of successful conversions, resulting in increased revenue.
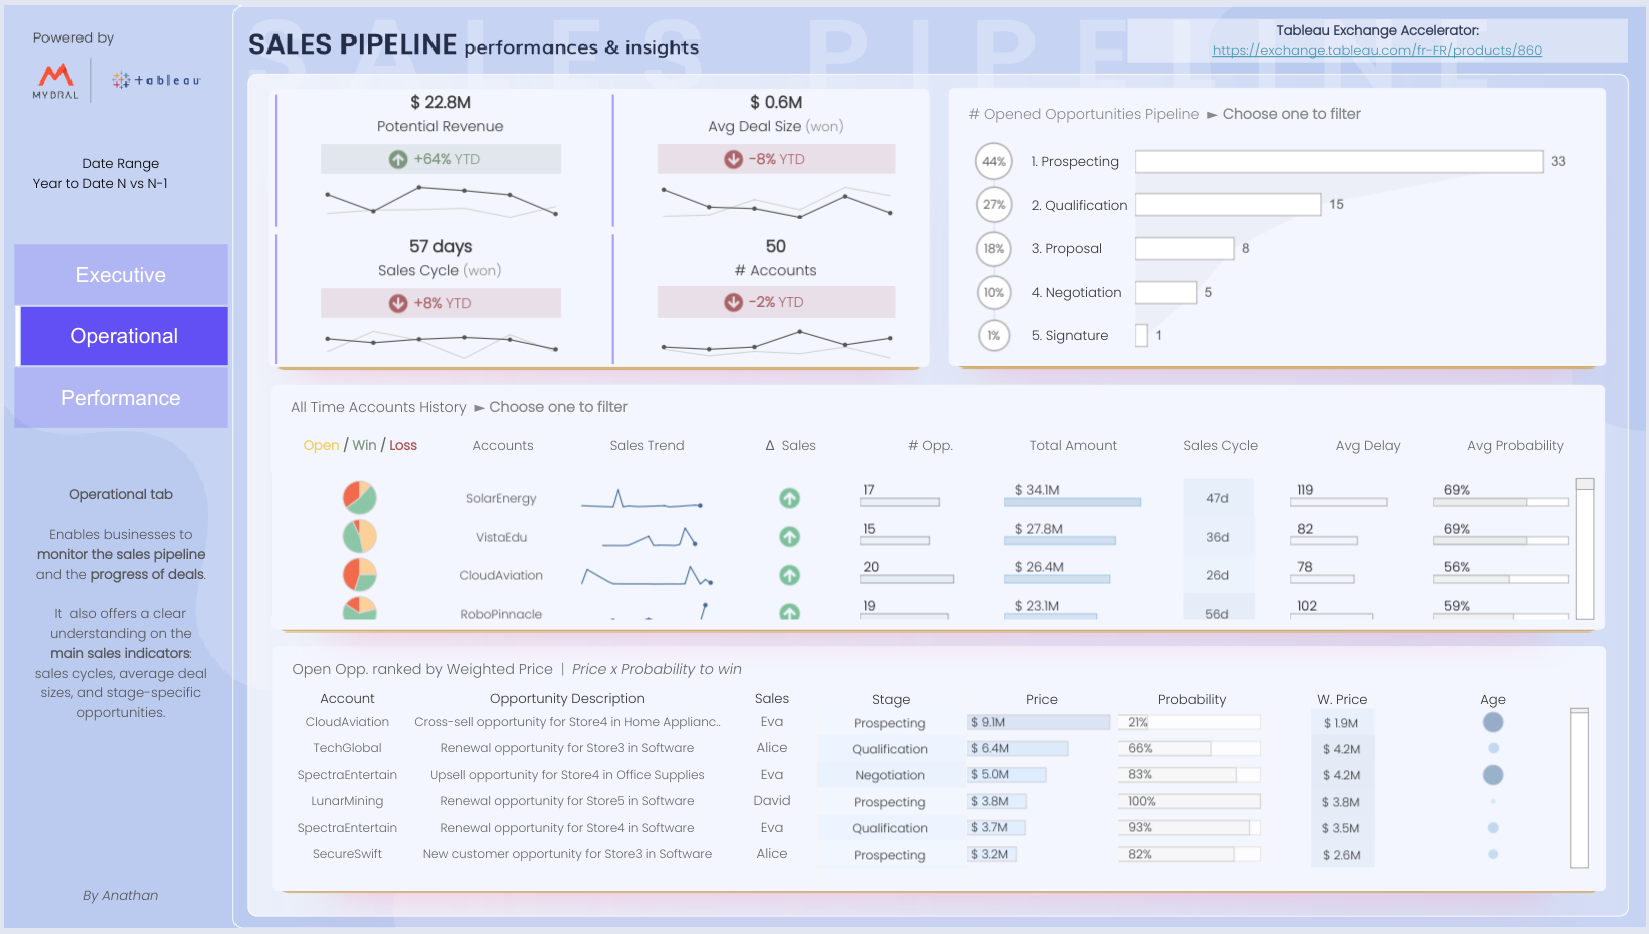
While a view of Pipeline Value has been harder to find than we’d expect, Anathan Huong-Parrain shows the value of won and lost opportunities in the dashboard below. We’ll build our own view of the relationship between pipeline value and conversion rate in a future post.
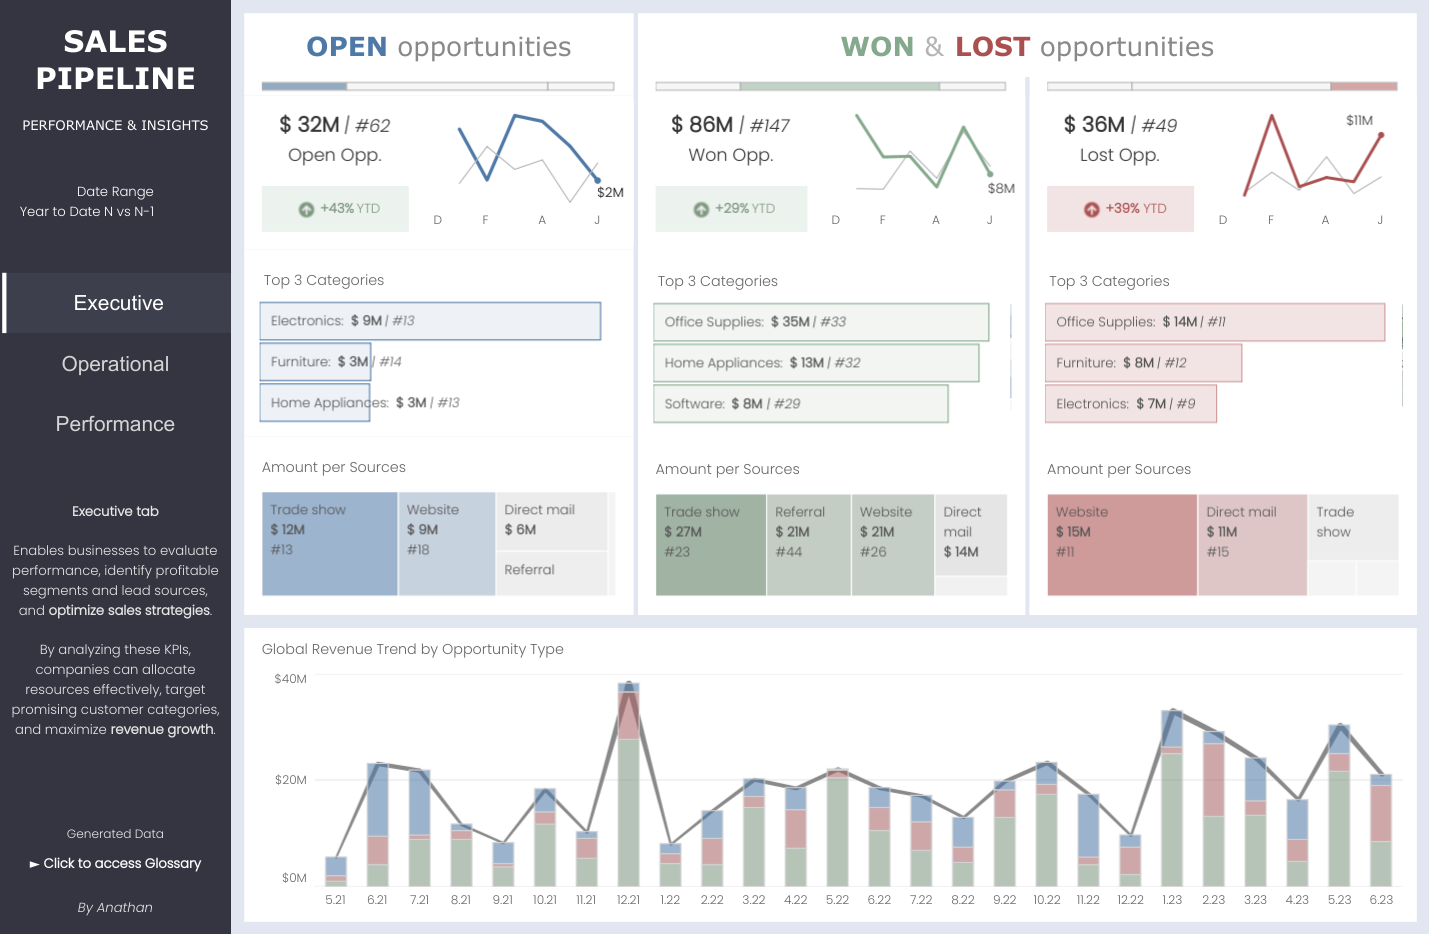
You can see the Pipeline Value in “Potential Revenue” in the dashboard below:
5. Lead-to-Opportunity Ratio and Opportunity-to-Win Ratio
A strong Lead-to-Opportunity Ratio is crucial for a higher Opportunity-to-Win Ratio. When we efficiently identify and qualify leads, the likelihood of those opportunities turning into successful deals improves significantly.
6. Sales Activities per Rep and Sales Team Quota Attainment
The number of Sales Activities per Rep directly influences the Sales Team Quota Attainment. More productive sales reps, engaging in more activities, are more likely to achieve their targets.
Sales teams tend to view sales activities as pure math. Let’s use an example to explain: let’s say the sales funnel runs from 1) cold call to 2) sales call to 3) meeting to 4) negotiated offering to 5) final sale, and the business knows that: 2% of prospects engage with a cold call (1), and 56% of those get a sales call (2), 60% of calls get a meeting (3), 38% of meetings lead to an offer (4) and 78% of offers lead to a sale (5). From there, it’s mostly math-related to see which sales rep, using the same scripts, tactics, and sales materials, will do the best. It’s the one with the most activities. Because 0.199% of sales emails eventually lead to a sale, the rep who does 100 cold calls a day (2,165 per month, selling 4.3 units) will make 1.5 more sales than someone who only makes 65 calls per day (selling 2.8 units). Put another way, the rep making 100 calls in a day is 35% more effective.
Metrics like these allow sales managers to extrapolate their sales revenue for a month and the overall value of their sales manager and reps. Also, if they analyze and improve their sales funnel, it magnifies those effects over the whole team. Improving cold calls’ effectiveness by 0.5% can lead to massive sales wins when all sales reps adopt those changes.
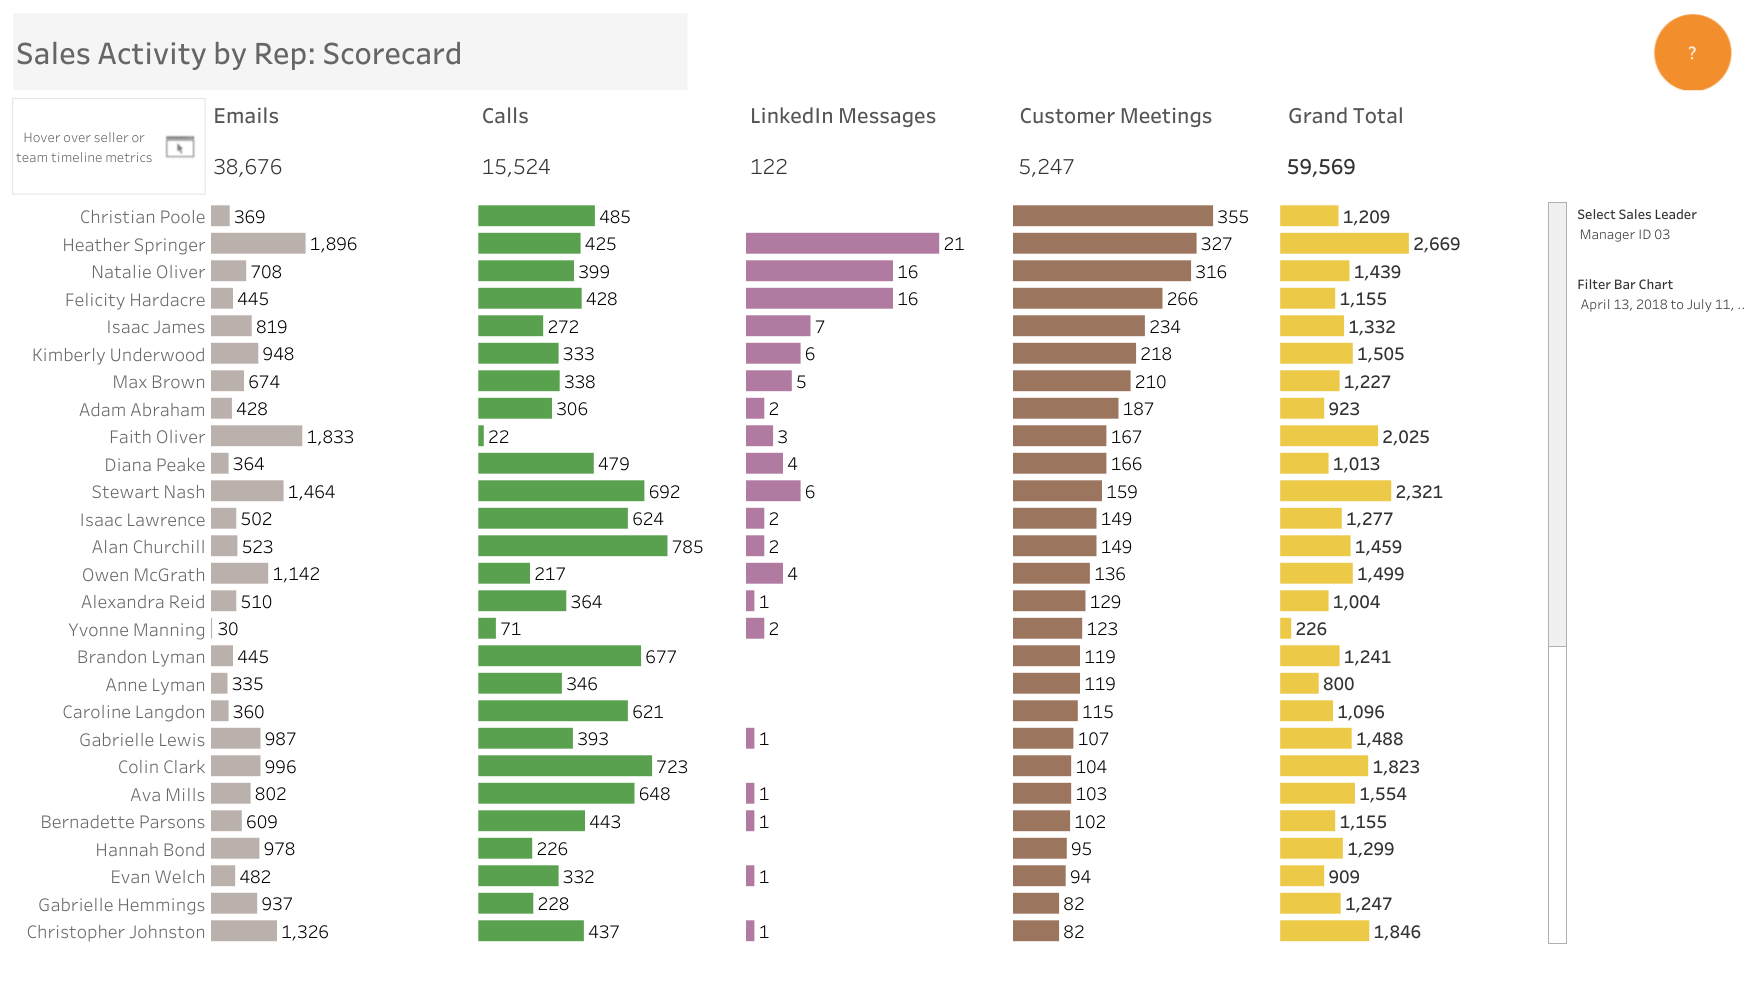
The dashboard below, again produced by the Tableau Sales Analytics team, shows overall activity. We will add one of our own soon that shows activities vs quota.
Conclusion
In conclusion, Sales KPIs are the compass that guides our sales team towards achieving business success. By understanding and effectively utilizing these metrics, we gain valuable insights into our sales performance, enabling data-driven decision-making and continuous improvement.
Each KPI plays a specific role, but together, they form a cohesive system that allows us to evaluate the efficiency of our sales process, customer acquisition, retention efforts, and revenue generation. The interconnection between these metrics further emphasizes the need for a holistic approach to sales management.
As we embrace the power of Sales KPIs and leverage their insights, we are equipped to steer our sales team towards higher levels of success and excellence, ultimately driving the growth and prosperity of our organization.